Filter
397
Text search:
graphs
Featured
28
109
Language
Document type
207
91
39
22
13
12
6
4
2
1
Countries
21
18
11
9
9
9
8
8
7
7
7
7
6
6
6
6
6
6
6
5
5
5
4
3
3
3
3
3
2
2
2
2
2
2
2
2
2
2
1
1
1
1
1
1
1
1
1
1
1
1
1
1
1
1
1
1
1
1
1
1
1
1
1
1
1
1
1
1
1
Authors & Publishers
Publication Years
Category
166
41
24
20
19
19
2
Toolboxes
22
19
19
18
16
16
15
14
12
11
11
10
10
9
9
6
6
5
5
4
3
3
3
2
2
Data presentation is the basis for describing data and generating hypotheses for further testing. It consists of a number of methods for summarising data in order to support the identification of patterns. Data can be summarised in a number of forms, including tables or graphical representations s
...
Interactive Graphs

Interactive Graphs

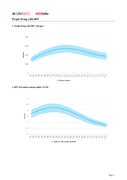
In 2014 UNICEF, WHO and the World Bank report new joint estimates of child malnutrition using available data up to 2013 The Interactive dashboard allows users to generate a variety of graphs and charts, using the newest joint estimates of prevalence
...

• provide scientific information on the safety, efficacy, and quality control/ quality assurance of widely used medicinal plants, in order to facilitate their appropriate use in Member States;
• provide models to assist Member States in developing their own mono-
...
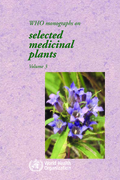
• provide scientific information on the safety, efficacy, and quality control/ quality assurance of widely used medicinal plants, in order to facilitate their appropriate use in Member States;
• provide models to assist Member States in developing their own mono-
...

• provide scientific information on the safety, efficacy, and quality control/ quality assurance of widely used medicinal plants, in order to facilitate their appropriate use in Member States;
• provide models to assist Member States in developing their own mono-
...
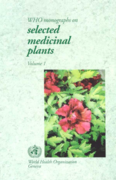
• provide scientific information on the safety, efficacy, and quality control/ quality assurance of widely used medicinal plants, in order to facilitate their appropriate use in Member States;
• provide models to assist Member States in developing their own mono-
...
The WSP QA Tool is an Excel-based Tool. It is compatible with the 2003, 2007 and 2010 versions of Excel. The Tool can be used to evaluate multiple water supply systems and/or over time (through use of the ‘create new’ feature).
The user can add additional questions to include in their assessmen
...
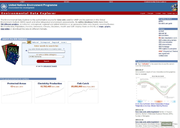
The Environmental Data Explorer is the authoritative source for data sets used by UNEP and its partners in the Global Environment Outlook (GEO) report and other integrated environment assessments. Its online database holds more than 500 different variables, as national, subregional, regional and glo
...
Epi Info™ is a public domain suite of interoperable software tools designed for the global community of public health practitioners and researchers. It provides for easy data entry form and database construction, a customized data entry experience, and data analyses with epidemiologic statistics,
...
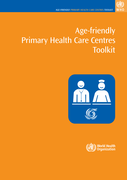
The toolkit's purpose is to:
improve the primary health care response for older persons.
sensitize and educate primary health care workers about the specific needs of their older clients.
provide primary care health workers with a set of tools/instruments to assess older people's hea
...
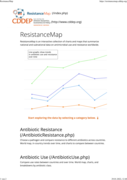
ResitanceMap
recommended
ResistanceMap is an interactive collection of charts and maps that summarize national and subnational data on antimicrobial use and resistance worldwide.
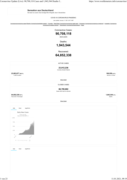
COVID-19 Coronavirus Pandemic - Worldometer
recommended
Daily Updates
A user-friendly instrument designed to collect and calculate indicators of effective inventory management. The IMAT guides the user through a process of collecting data on the physical and theoretical stock balance and the duration of stockouts for a set of up to 25 frequently-used products, calcula
...

Global Biodiversity Outlook (GBO) is the flagship publication of the Convention on Biological Diversity (CBD). It is a periodic report that summarizes the latest data on the status and trends of biodiversity and draws conclusions relevant to the further implementation of the Convention.
GBO-5 provi
...
Refugee Health
recommended
An approach to emergency situations. Relief workers face rapidly changing and complex environments, new disease patterns, enormous humanitarian needs and relatively limited resources. The authors of this book use their experience in the area to produce an operational manual of the issues involved in
...
Epidemic diarrhoeal disease preparedness and response. Training and practice. Participant's manual
recommended
Accessed November 2014