Filter
1128
Text search:
charts
Featured
118
337
Language
Document type
651
139
136
73
65
29
13
10
4
4
2
2
Countries
100
46
34
32
32
32
30
30
25
22
19
18
17
17
15
15
14
13
11
10
9
9
8
7
7
7
6
6
6
6
6
5
5
4
4
4
4
4
4
4
3
3
3
3
3
2
2
2
2
2
2
2
1
1
1
1
1
1
1
1
1
1
1
1
1
1
1
1
1
1
1
1
1
1
1
1
1
1
Authors & Publishers
Publication Years
Category
520
111
109
75
70
62
9
Toolboxes
66
65
52
44
36
33
30
27
27
22
21
20
17
17
17
17
15
11
11
9
8
8
4
4
1
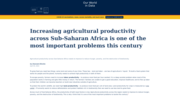
Agricultural productivity across Sub-Saharan Africa needs to improve to reduce hunger, poverty, and the destruction of biodiversity.
Both Ukraine and Russia are some of the world’s largest food exporters. How could global food be impacted?


The article "Cardiovascular Diseases" on Our World in Data provides an in-depth analysis of cardiovascular diseases (CVD), the leading cause of death globally. It examines CVD trends, such as the decline in mortality rates in high-income countries due to improved healthcare and lifestyle changes, wh
...

There are two sets of charts. One set (14 charts) can be used in settings where blood cholesterol can be measured. The other set (14 charts) is for
...

To help adapt cardiovascular disease risk prediction approaches to low-income and middle-income countries, WHO has convened an effort to develop, evaluate, and illustrate revised risk models. Here, we report the derivation, validation, and illustration of the revised WHO cardiovascular disease risk
...

Ensuring healthy lives and promoting well-being for all is possible – but only if economically better-off and disadvantaged countries play their part

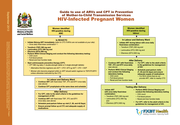
Dosing Recommendations for Prevention and Treatment

Flip Charts to COPSI Manual
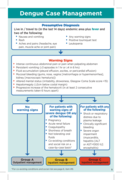
Flow Charts

Flip charts for trachoma community volunteers

Interactive charts
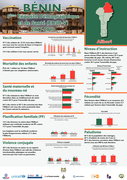
12 departmental wall charts

12 departmental wall charts

12 Departmental Wall Charts
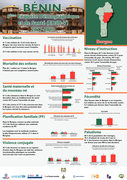
12 Departmental Wall Charts
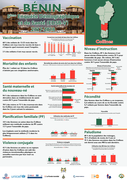
12 Departmental Wall Charts
12 Departmental Wall Charts