Filter
645
Text search:
dashboard
Featured
90
104
Language
Document type
197
152
88
61
42
29
28
27
9
8
3
1
Countries
34
22
21
20
20
19
18
18
18
17
16
14
12
11
11
11
11
10
9
9
9
9
9
8
8
8
8
7
7
7
7
6
6
6
6
5
5
5
5
5
4
4
4
4
4
4
4
3
3
3
3
3
3
3
3
3
3
3
3
2
2
2
2
2
2
2
2
2
2
2
2
2
2
2
2
2
1
1
1
1
1
1
1
1
1
1
1
1
1
1
1
1
1
1
1
Authors & Publishers
Publication Years
Category
302
37
25
20
17
8
1
1
Toolboxes
222
36
33
20
20
20
19
18
17
17
11
9
9
8
8
7
6
5
4
4
3
3
3
MEDBOX Issue Brief : إصدار موجز عن كوفيد-19
recommended
فيما يسمى بـ "الرسائل الإخبارية"، يقوم فريق ميدبوكس بجمع الوثائق والمعلومات المتعلقة بـ كوفيد -19 في شكل مرئي. نرحب بتعليقاتكم حول التنسيق والمحتوى، بالإضافة إلى مزي�
...
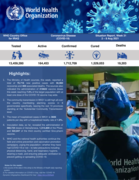
The African region reports the highest number of health emergencies of all the WHO regions every year: an average of
2-3 new events every week

Here are the answers to the most common queries about the novel coronavirus based on our discussion with the various experts from the reputed institutes and analysis of the CDC, WHO, and MoHFW guidelines.
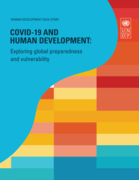
The United Nations Development Programme (UNDP) today released two new data dashboards that highlight the huge disparities in countries’ abilities to cope with and recover from the COVID-19 crisis.
The pandemic is more than a global health emergency. It is a systemic human development crisis, a
...
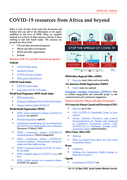
A list of some of the many free documents and websites that can add to the information in the papers published in this issue of SSMJ. Many are regularly updated. Let us know of other resources relevant to those working in and with South Sudan.

August 2020
Entwicklungen und gegenwärtige Situationen der Covid-19-Impfstoffe
26 July 2021
SARS-CoV-2 infections among children and adolescents cause less severe illness and fewer deaths compared to adults. While a less severe course of infection is a positive outcome, there are concerns that mild symptoms may have led to less testing, resulting in fewer identified cases of COVID-19 in ch
...
Eastern and Southern Africa

COVID-19 Situation Update OPS/WHO Argentina: 10 February 2022
Situation report generated by the OPS/WHO representation in Argentina

COVID-19 Progress Report PAHO/WHO Argentina: 24 February 2022
Epidemiología; Resumen de puntos clave de conferencias y declaraciones de interés de OPS/OMS; Variantes de interés y preocupación; Actualización en vacunas; OPS/OMS en redes sociales; Publicaciones relacionadas; Noticias de la Regi�
...
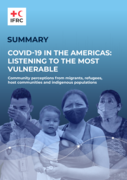
This research report offers community perceptions of COVID-19 from migrants, refugees, host communities and indigenous populations in nine countries in the Americas: Argentina, Brazil, Bolivia, Colombia, Guatemala, Nicaragua, Jamaica, Panama and Trinidad and Tobago.
It reveals the myriad impacts
...
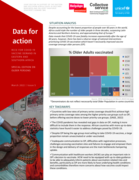
Data for Action March 2022, Issue 5
The World Health Organization (WHO) recognizes the challenges countries face for maintaining their COVID-19 response while addressing competing public health challenges, conflicts, climate change and economic crises. WHO continues to support countries in adjusting COVID-19 strategies to reflect succ
...

The World Health Organization (WHO) recognizes the challenges countries face for maintaining their COVID-19 response while addressing competing public health challenges, conflicts, climate change and economic crises.
It remains critical for national programmes to continue to offer testing for COVI
...