Filter
3195
Text search:
health
and
demographic
data
Featured
163
1090
Language
3114
56
48
25
15
15
8
7
4
2
1
1
1
1
1
1
1
1
1
1
Document type
1999
644
211
112
102
58
29
21
11
7
1
Countries
150
134
124
121
96
96
94
90
90
86
84
78
75
74
73
69
61
53
48
48
47
45
42
41
40
33
31
30
27
26
26
24
19
18
17
16
16
16
14
14
14
13
12
12
12
11
10
10
10
10
10
9
8
8
7
7
7
7
7
7
7
6
6
6
6
5
5
5
4
4
4
4
4
4
4
4
3
3
3
3
3
3
2
2
2
2
2
2
2
2
2
2
2
2
2
2
1
1
1
1
1
1
1
1
1
1
1
1
1
1
1
1
1
1
1
1
1
1
1
1
1
1
1
1
Authors & Publishers
303
97
92
86
70
66
56
51
37
36
28
21
20
19
18
16
15
14
14
13
13
13
12
12
12
12
11
11
11
11
11
10
10
10
10
9
9
9
9
9
8
8
8
8
8
8
8
8
7
7
7
7
7
7
7
7
7
7
7
7
6
6
6
6
6
6
6
6
6
6
5
5
5
5
5
5
5
5
5
5
5
5
5
5
5
5
5
5
5
5
5
5
5
5
5
4
4
4
4
4
4
4
4
4
4
4
4
4
4
4
4
4
4
4
4
4
4
4
4
4
4
4
4
4
4
4
4
4
4
4
4
4
4
4
4
4
3
3
3
3
3
3
3
3
3
3
3
3
3
3
3
3
3
3
3
3
3
3
3
3
3
3
3
3
3
3
3
3
3
3
3
3
3
3
3
3
3
3
3
3
3
3
3
3
3
3
3
3
3
3
3
3
3
3
3
3
3
3
3
3
3
3
2
2
2
2
2
2
2
2
2
2
2
2
2
2
2
2
2
2
2
2
2
2
2
2
2
2
2
2
2
2
2
2
2
2
2
2
2
2
2
2
2
2
2
2
2
2
2
2
2
2
2
2
2
2
2
2
2
2
2
2
2
2
2
2
2
2
2
2
2
2
2
2
2
2
2
2
2
2
2
2
2
2
2
2
2
2
2
2
2
2
2
2
2
2
2
2
2
2
2
2
2
2
2
2
2
2
2
2
2
2
2
2
2
2
2
2
2
2
2
2
2
2
2
2
2
2
2
2
2
2
2
2
2
2
2
2
2
2
2
2
2
2
2
2
2
2
2
2
2
2
2
2
2
2
2
2
2
2
2
2
2
2
2
2
2
2
2
2
2
2
2
2
2
2
2
2
2
2
2
2
2
2
2
2
2
2
2
2
2
2
2
2
2
2
2
2
2
1
1
1
1
1
1
1
1
1
1
1
1
1
1
1
1
1
1
1
1
1
1
1
1
1
1
1
1
1
1
1
1
1
1
1
1
1
1
1
1
1
1
1
1
1
1
1
1
1
1
1
1
1
1
1
1
1
1
1
1
1
1
1
1
1
1
1
1
1
1
1
1
1
1
1
1
1
1
1
1
1
1
1
1
1
1
1
1
1
1
1
1
1
1
1
1
1
1
1
1
1
1
1
1
1
1
1
1
1
1
1
1
1
1
1
1
1
1
1
1
1
1
1
1
1
1
1
1
1
1
1
1
1
1
1
1
1
1
1
1
1
1
1
1
1
1
1
1
1
1
1
1
1
1
1
1
1
1
1
1
1
1
1
1
1
1
1
1
1
1
1
1
1
1
1
1
1
1
1
1
1
1
1
1
1
1
1
1
1
1
1
1
1
1
1
1
1
1
1
1
1
1
1
1
1
1
1
1
1
1
1
1
1
1
1
1
1
1
1
1
1
1
1
1
1
1
1
1
1
1
1
1
1
1
1
1
1
1
1
1
1
1
1
1
1
1
1
1
1
1
1
1
1
1
1
1
1
1
1
1
1
1
1
1
1
1
1
1
1
1
1
1
1
1
1
1
1
1
1
1
1
1
1
1
1
1
1
1
1
1
1
1
1
1
1
1
1
1
1
1
1
1
1
1
1
1
1
1
1
1
1
1
1
1
1
1
1
1
1
1
1
1
1
1
1
1
1
1
1
1
1
1
1
1
1
1
1
1
1
1
1
1
1
1
1
1
1
1
1
1
1
1
1
1
1
1
1
1
1
1
1
1
1
1
1
1
1
1
1
1
1
1
1
1
1
1
1
1
1
1
1
1
1
1
1
1
1
1
1
1
1
1
1
1
1
1
1
1
1
1
1
1
1
1
1
1
1
1
1
1
1
1
1
1
1
1
1
1
1
1
1
1
1
1
1
1
1
1
1
1
1
1
1
1
1
1
1
1
1
1
1
1
1
1
1
1
1
1
1
1
1
1
1
1
1
1
1
1
1
1
1
1
1
1
1
1
1
1
1
1
1
1
1
1
1
1
1
1
1
1
1
1
1
1
1
1
1
1
1
1
1
1
1
1
1
1
1
1
1
1
1
1
1
1
1
1
1
1
1
1
1
1
1
1
1
1
1
1
1
1
1
1
1
1
1
1
1
1
1
1
1
1
1
1
1
1
1
1
1
1
1
1
1
1
1
1
1
1
1
1
1
1
1
1
1
1
1
1
1
1
1
1
1
1
1
1
1
1
1
1
1
1
1
1
1
1
1
1
1
1
1
1
1
1
1
1
1
1
1
1
1
1
1
1
1
1
1
1
1
1
1
1
1
1
1
1
1
1
1
1
1
1
1
1
1
1
1
1
1
1
1
1
1
1
1
1
1
1
1
1
1
1
1
1
1
1
1
1
1
1
1
1
1
1
1
1
1
1
1
1
1
1
1
1
1
1
1
1
1
1
1
1
1
1
1
1
1
1
1
1
1
1
1
1
1
1
1
1
1
1
1
1
1
1
1
1
1
1
1
1
1
1
1
1
1
1
1
1
1
1
1
1
1
1
1
1
1
1
1
1
1
1
1
1
1
1
1
1
1
1
1
1
1
1
1
1
1
1
1
1
1
1
1
1
1
1
1
1
1
1
1
1
1
1
1
1
1
1
1
1
1
1
1
1
1
1
1
1
1
1
1
1
1
1
1
1
1
1
1
1
1
1
1
1
1
1
1
1
1
1
1
1
1
1
1
1
1
1
1
1
1
1
1
1
1
1
1
1
1
1
1
1
1
1
1
1
1
1
1
1
1
1
1
1
1
1
1
1
1
1
1
1
1
1
1
1
1
1
1
1
1
1
1
1
1
1
1
1
1
1
1
1
1
1
1
1
1
1
1
1
1
1
1
1
1
1
1
1
1
1
1
1
1
1
1
1
1
1
1
1
1
1
1
1
1
1
1
1
1
1
1
1
1
1
1
1
1
1
1
1
1
1
1
1
1
1
1
1
1
1
1
1
1
1
1
1
1
1
1
1
1
1
1
1
1
1
1
1
1
1
1
1
1
1
1
1
1
1
1
1
1
1
1
1
1
1
1
1
1
1
1
1
1
1
1
1
1
1
1
1
1
1
1
1
1
1
1
1
1
1
1
1
1
1
1
1
1
1
1
1
1
1
1
1
1
1
1
1
1
1
1
1
1
1
1
1
1
1
1
1
1
1
1
1
1
1
1
1
1
1
1
1
1
1
1
1
1
1
1
1
1
1
1
1
1
1
1
1
1
1
1
1
1
1
1
1
1
1
1
1
1
1
1
1
1
1
1
1
1
1
1
1
1
1
1
1
1
1
1
1
1
1
1
1
1
1
1
1
1
1
1
1
1
1
1
1
1
1
1
1
1
1
1
1
1
1
1
1
1
1
1
1
1
1
1
1
1
1
1
1
1
1
1
1
1
1
1
1
1
1
1
1
1
1
1
1
1
1
1
1
1
1
1
1
1
1
1
1
1
1
1
1
1
1
1
1
1
1
1
1
1
1
1
1
1
1
1
1
1
1
1
1
1
1
1
1
1
1
1
1
1
1
1
1
1
1
1
1
1
1
1
1
1
1
1
1
1
1
1
1
1
1
1
1
1
1
1
1
1
1
1
1
1
1
1
1
1
1
1
1
1
1
1
1
1
1
1
1
1
1
1
1
1
1
1
1
1
1
1
1
1
1
1
1
1
1
1
1
1
1
1
1
1
1
1
1
1
1
1
1
1
1
1
1
1
1
1
1
1
1
1
1
1
1
1
1
1
1
1
1
1
1
1
1
1
1
1
1
1
1
1
1
1
1
1
1
1
1
1
1
1
1
1
1
1
1
1
1
1
1
1
1
1
1
1
1
1
1
1
1
1
1
1
1
1
1
1
1
1
1
1
1
1
1
1
1
1
1
1
1
1
1
1
1
1
1
1
1
1
1
1
1
1
1
1
1
1
1
1
1
1
1
1
1
1
1
1
1
1
1
1
1
1
1
1
1
1
1
1
1
1
1
1
1
1
1
1
1
1
1
1
1
1
1
1
1
1
1
1
1
1
1
1
1
1
1
1
1
1
1
1
1
1
1
1
1
1
1
1
1
1
1
1
1
1
1
1
1
1
1
1
1
1
1
1
1
1
1
1
1
1
1
1
1
1
1
1
1
1
1
1
1
1
1
1
1
1
1
1
1
1
1
1
1
1
1
1
1
1
1
1
1
1
1
1
1
1
1
1
1
1
1
1
1
1
1
1
1
1
1
1
1
1
1
1
1
1
1
1
1
1
1
1
1
1
1
1
1
1
1
1
1
1
1
1
1
1
1
1
1
1
1
1
1
1
1
1
1
1
1
1
1
1
1
1
1
1
1
1
1
1
1
1
1
1
1
1
1
1
1
1
1
1
1
1
1
1
1
1
1
1
1
1
1
1
1
1
1
1
1
1
1
1
1
1
1
1
1
1
1
1
1
1
1
1
1
1
1
1
1
1
1
1
1
1
1
1
1
1
1
1
1
1
1
1
1
1
1
1
1
1
1
1
1
1
1
1
1
1
1
1
1
1
1
1
1
1
1
1
1
1
1
1
1
1
1
1
1
1
1
1
1
1
1
1
1
1
1
1
1
1
1
1
1
1
1
1
1
1
1
1
1
1
1
1
1
1
1
1
1
1
1
1
1
1
1
1
1
1
1
1
1
1
1
1
1
1
1
1
1
1
1
1
1
1
1
1
1
1
1
1
1
1
1
1
1
1
1
1
1
1
1
1
1
1
1
1
1
1
1
1
1
1
1
1
1
1
1
1
1
1
1
1
1
1
1
1
1
1
1
1
1
1
1
1
1
1
1
1
1
1
1
1
1
1
1
1
1
1
1
1
1
1
1
1
1
1
1
1
1
1
1
1
1
1
1
1
1
1
1
1
1
1
1
1
1
1
1
1
1
1
1
1
1
1
1
1
1
1
1
1
1
1
1
1
1
1
1
1
1
1
1
1
1
1
1
1
1
1
1
1
1
1
1
1
1
1
1
1
1
1
1
1
1
1
1
1
1
1
1
1
1
1
1
1
1
1
1
1
1
1
1
1
1
1
1
1
1
1
1
1
1
1
1
1
1
1
1
1
1
1
1
1
1
1
1
1
1
1
1
1
1
1
1
1
1
1
1
1
1
1
1
1
1
1
1
1
1
1
1
1
1
1
1
1
1
1
1
1
1
1
1
1
1
1
1
1
1
1
1
1
1
1
1
1
1
1
1
1
1
1
1
1
1
1
1
1
1
1
1
1
1
1
1
1
1
1
1
1
1
1
1
1
1
1
1
1
1
1
1
1
1
1
1
1
1
1
1
1
1
1
1
1
1
1
1
1
1
1
1
1
1
1
1
1
1
1
1
1
1
1
1
1
1
1
1
1
1
1
1
1
1
1
1
1
1
1
1
1
1
1
1
1
1
1
1
1
1
1
1
1
1
1
1
1
1
1
1
1
1
1
1
1
1
1
1
1
1
1
1
1
1
1
1
1
1
1
1
1
1
1
1
1
1
1
1
1
1
1
1
1
1
1
1
1
1
1
1
1
1
1
1
1
1
1
1
1
1
1
1
1
1
1
1
1
1
1
1
1
1
1
1
1
1
1
1
1
1
1
1
1
1
1
1
1
1
1
1
1
1
1
1
1
1
1
1
1
1
1
1
1
1
1
1
1
1
1
1
1
1
1
1
1
1
1
1
1
1
1
1
1
1
1
1
1
1
1
1
1
1
1
1
1
1
1
1
1
1
1
1
1
1
1
1
1
1
1
1
1
1
1
1
1
1
1
1
1
1
1
1
1
1
1
1
1
1
1
1
1
1
1
1
1
1
1
1
1
1
1
1
1
1
1
1
1
1
1
1
1
1
1
1
1
1
1
1
1
1
1
1
1
1
1
1
1
1
1
1
1
1
1
1
1
1
1
1
1
1
1
1
1
1
1
1
1
1
1
1
1
1
1
1
1
1
1
1
1
1
1
1
1
1
1
1
1
1
1
1
1
1
1
1
1
1
1
1
1
1
1
1
1
1
1
1
1
1
1
1
1
1
1
1
1
1
1
1
1
1
1
1
1
1
1
1
1
1
1
1
1
1
1
1
1
1
1
1
1
1
1
1
1
1
1
1
1
1
1
1
1
1
1
1
1
1
1
1
1
1
1
1
1
1
1
1
1
1
1
1
1
1
1
1
1
1
1
1
1
1
1
1
1
1
1
1
1
1
1
1
1
1
1
1
1
1
1
1
1
1
1
1
1
1
1
1
1
1
1
1
1
1
1
1
1
1
1
1
1
1
1
1
1
1
1
1
1
1
1
1
1
1
1
1
1
1
1
1
1
1
1
1
1
1
1
1
1
1
1
1
1
1
1
1
1
1
1
1
1
1
1
1
1
1
1
1
1
1
1
1
1
1
1
1
1
1
1
1
1
1
1
1
1
1
1
1
1
1
1
1
1
1
1
1
1
1
1
1
1
1
1
1
1
1
1
1
1
1
1
1
1
1
1
1
1
1
1
1
1
1
1
1
1
1
1
1
1
1
1
1
1
1
1
1
1
1
1
1
1
1
1
1
1
1
1
Publication Years
750
2200
237
6
2
Category
1850
185
166
140
120
27
11
Toolboxes
200
144
116
111
102
71
69
66
62
60
54
50
49
46
44
34
30
26
24
22
15
11
6
6
4

For the 24th consecutive year, PAHO has published the report Health Situation in the Americas: Core Indicators featuring the latest information on key indicators for the Region of the Americas. This 2018 edition includes
...
data on the 82 core indicators for the countries, territories, and sub regions of the Americas, grouped into the following categories: demographic-socioeconomic, health status, risk factors, service coverage, and health systems. Information is also presented on 22 indicators of the Sustainable Development Goals (SDGs).
more

Contains data from World Health Organization's data portal covering the following categories:
Mortality
...
and global health estimates, Sustainable development goals, Millennium Development Goals (MDGs), Health systems, Malaria, Tuberculosis, Child health, Infectious diseases, Neglected Tropical Diseases, World Health Statistics, Health financing, Tobacco, Substance use and mental health, Injuries and violence, HIV/AIDS and other STIs, Public health and environment, Nutrition, Urban health, Noncommunicable diseases, Noncommunicable diseases CCS, Negelected tropical diseases, Infrastructure, Essential health technologies, Medical equipment, Demographic and socioeconomic statistics, Health inequality monitor, Health Equity Monitor, Child malnutrition, TOBACCO, Neglected tropical diseases, International Health Regulations (2005) monitoring framework, 0, Insecticide resistance, Oral health, Universal Health Coverage, Global Observatory for eHealth (GOe)
more
Massoda Tonye et al. Malar J (2018) 17:156
https://doi.org/10.1186/s12936-018-2284-7
Background: In 2011, the demographic and health survey (DH
...
S) in Cameroon was combined with the multiple indicator
cluster survey. Malaria parasitological data were collected, but the survey period did not overlap with the high
malaria transmission season. A malaria indicator survey (MIS) was also conducted during the same year, within the
malaria peak transmission season. This study compares estimates of the geographical distribution of malaria parasite
risk and of the effects of interventions obtained from the DHS and MIS survey data.
more
Heart failure (HF) is a global public health concern with disproportionate socioeconomic, morbidity and mortality burden on low- and middle-income
...
countries (LMICs). This review summarises contemporary data on the demographic and clinical characteristics, aetiologies, treatment, economic burden and outcomes of HF in LMICs. Patients with HF in LMICs are younger than those from high-income countries (HICs) and present at advanced stages of the disease. Hypertension, ischaemic heart disease (IHD), cardiomyopathy (CMO), and rheumatic heart disease (RHD) are the leading causes of HF in LMICs. The contribution of infectious diseases to HF remains prominent in many LMICs. Most health facilities in LMICs lack adequate diagnostic tools for HF, and the use of evidence-based medical and device therapies is suboptimal. Further, HF in LMICs is associated with prolonged hospital stay and high in-hospital and one-year mortality. Finally, HF has profound economic impact on individual patients who, mostly, have no health insurance, and on societies where patients are young, comprising those who have the greatest potential to contribute to economic productivity.
more
Impact of health systems strengthening on coverage of maternal health services in Rwanda, 2000–2010: a systematic review
Maurice Bucagu, Jean M. Kagubare, Paulin Basinga, Fidèle Ngabo, Barbara K Timmons & Angela C Lee
Reproductive Health Matters
(2012)
CC
From 2000 to 2010, Rwanda implemented comprehensive health sector reforms to strengthen the public health system, with the aim of reducing maternal and
...
newborn deaths in line with Millennium Development Goal 5, among many other improvements in national health. Based on a systematic review of the literature, national policy documents and three Demographic & Health Surveys (2000, 2005 and 2010), this paper describes the reforms and the policies they were based on, and provides data on the extent of Rwanda’s progress in expanding the coverage of four key women’s health services. Progress took place in 2000–2005 and became more rapid after 2006, mostly in rural areas, when the national facility-based childbirth policy, performance-based financing, and community-based health insurance were scaled up. Between 2006 and 2010, the following increases in coverage took place as compared to 2000–2005, particularly in rural areas, where most poor women live: births with skilled attendance (77% increase vs. 26%), institutional delivery (146% increase vs. 8%), and contraceptive prevalence (351% increase vs. 150%). The primary factors in these improvements were increases in the health workforce and their skills, performance-based financing, community-based health insurance, and better leadership and governance. Further research is needed to determine the impact of these changes on health outcomes in women and children.
more

Background: Data on burden of peripheral artery disease (PAD) and its attributable risk factors are valuable for policymaking. We aimed to estimate the burden
...
and risk factors for PAD from 1990 to 2019.
Methods: We extracted the data on prevalence, incidence, death, years lived with disability (YLDs), and years of life lost (YLLs) from the Global Burden of Disease Study 2019 to measure PAD burden. Moreover, the attributable burden to PAD risk factors was also estimated.
Results: Globally, in 2019, 113,443,017 people lived with PAD and 10,504,092 new cases occurred, resulting in 74,063 deaths, 500,893 YLDs, and 1,035,487 YLLs. The absolute numbers of PAD prevalent and incident cases significantly increased between 1990 and 2019, contrasting with the decline trends in age-standardized prevalence and incidence rates. However, no statistically significant changes were detected in the global age-standardized death or YLL rates. The burden of PAD and its temporal trends varied significantly by location, gender, age group, and social-demographic status. Among all potentially modifiable risk factors, age-standardized PAD deaths worldwide were primarily attributable to high fasting plasma glucose, followed by high systolic blood pressure, tobacco, kidney dysfunction, diet high in sodium, and lead exposure.
Conclusion: PAD remained a serious public health problem worldwide. More strategies aimed at implementing cost-effective interventions and addressing modifiable risk factors should be carried out, especially in regions with high or increasing burden.
more
DHS Methodological Report No. 20
This study used Service Provision Assessment (SPA) and Demographic and ... Health Survey (DHS) data from Haiti, Malawi, and Tanzania to compare traditionally used additive methods with a data reduction method—principal component analysis (PCA).
We scored the quality of health facilities with three approaches (simple additive, weighted additive, and PCA) for two constructs: quality of services, with only facilities-level data, and quality of care, which incorporates observation and client data. We ranked facilities as high, medium, or low quality based on their scores. Our results indicated that the rankings change with the scoring methodology. There was more consistency in the rankings of facilities by the simple additive and PCA methods than the weighted additive and PCA-based rankings. This may be due to the low factor loadings and little variance explained by the first component in the PCA. We aggregated facility scores to their respective DHS clusters (Haiti, Malawi) or regions (Tanzania) and geographically linked them to women interviewed in DHS surveys to test associations between the use of family planning services and the quality environment, as measured with each index. more
Demographic and socioeconomic data Progress towards HIV testing and treatment cascade targets b
...
y 2025 (2023) Health sector cascade (2023) Estimated number of people newly infected with HIV
more

Trends in Neonatal Mortality in Rwanda, 2000-2010
Winter, Rebecca, Thomas Pullum, Anne Langston, Ndicunguye V. Mivumbi, Pierre C. Rutayisire, Dieudonne N. Muhoza, and Solange Hakiba
Calverton, Maryland, USA: ICF International.
(2013)
C2
DHS Further Analysis Reports No. 88 - This further analysis examines levels, trends, and determinants of neonatal mortality in Rwanda, using data from the 2000, 2005,
...
and 2010 Rwanda Demographic and Health Surveys (RDHS).
more

This report aims to outline the current available knowledge on the health and wellbeing of older persons in the Region of the Americas during the United Nations Decade of Healthy Ageing (2021-2030).
...
It also seeks to guide political actions towards ensuring the human rights of older persons, and describes the negotiation and drafting process behind the Inter-American Convention on Protecting the Human Rights of Older Persons. It reports on the doctrinal and legal developments that led the Region of the Americas to draft the Convention and describes its action areas and guaranteed rights, as well as the obligations assumed by the States Parties. The Convention is an essential tool to advance the strategies of the Decade of Healthy Ageing. This publication reflects on the importance of having a major legal instrument for this purpose at the international level. The demographic transition in Latin America and the Caribbean will continue to shape the ability of countries and health systems to respond to the needs of the population. Given this reality, international instruments will be needed to guarantee the full enjoyment of the human rights of older persons. In order to design inclusive and sustainable systems, accurate, updated, and effective information is required. The Decade of Healthy Ageing––the initiative that constitutes the framework for this document––is a strategic period in which to focus on data generation and monitoring.
more
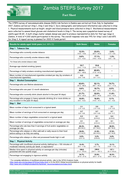
The STEPS survey of noncommunicable disease (NCD) risk factors in Zambia was carried out from July to September 2017. Zambia carried out Step 1, Step 2 and Step 3. Socio demographic
...
and behavioural information was collected in Step 1. Physical measurements such as height, weight and blood pressure were collected in Step 2. Biochemical measurements were collected to assess blood glucose and cholesterol levels in Step 3. The survey was a population-based survey of adults aged 18-69. A multi-stage cluster sample design was used to produce representative data for that age range in Zambia. A total of 4,302 adults participated in the survey. The overall response rate was 74% for Step 1 and 2 and 65% for Step 3. A repeat survey is planned for 2022 if funds permit.
more