Filter
1930
Text search:
poverty
trends
Featured
105
582
Language
1888
30
22
20
18
6
6
5
3
1
1
1
Document type
1067
550
108
96
52
20
19
13
5
Countries
136
80
78
55
53
49
49
47
42
39
38
37
37
36
34
34
33
33
31
29
25
21
19
19
16
16
15
15
14
13
13
12
11
11
11
10
10
9
9
9
9
8
8
8
8
7
7
7
6
6
5
5
5
5
5
5
5
5
4
4
4
4
4
4
4
3
3
3
3
3
3
2
2
2
2
2
2
2
1
1
1
1
1
1
1
1
1
1
1
1
1
1
1
1
1
1
1
1
1
1
1
1
1
1
1
1
1
1
1
1
1
1
1
1
1
Authors & Publishers
154
63
52
45
42
35
25
23
21
19
16
16
14
13
13
13
13
11
11
11
11
10
10
9
9
8
8
8
7
7
7
7
7
7
7
7
7
6
6
6
6
6
6
6
6
6
5
5
5
5
5
5
5
5
5
5
5
5
5
4
4
4
4
4
4
4
4
4
4
4
4
4
4
4
4
3
3
3
3
3
3
3
3
3
3
3
3
3
3
3
3
3
3
3
3
3
3
3
3
3
3
3
3
3
3
3
3
3
3
3
3
3
3
3
3
3
3
3
3
3
3
3
3
3
3
3
2
2
2
2
2
2
2
2
2
2
2
2
2
2
2
2
2
2
2
2
2
2
2
2
2
2
2
2
2
2
2
2
2
2
2
2
2
2
2
2
2
2
2
2
2
2
2
2
2
2
2
2
2
2
2
2
2
2
2
2
2
2
2
2
2
2
2
2
2
2
2
2
2
2
2
2
2
2
2
2
2
2
2
2
2
2
2
2
2
2
2
2
2
2
2
2
2
2
2
2
2
2
2
2
2
2
2
2
2
2
2
2
2
2
2
2
2
2
2
2
2
2
2
2
2
2
1
1
1
1
1
1
1
1
1
1
1
1
1
1
1
1
1
1
1
1
1
1
1
1
1
1
1
1
1
1
1
1
1
1
1
1
1
1
1
1
1
1
1
1
1
1
1
1
1
1
1
1
1
1
1
1
1
1
1
1
1
1
1
1
1
1
1
1
1
1
1
1
1
1
1
1
1
1
1
1
1
1
1
1
1
1
1
1
1
1
1
1
1
1
1
1
1
1
1
1
1
1
1
1
1
1
1
1
1
1
1
1
1
1
1
1
1
1
1
1
1
1
1
1
1
1
1
1
1
1
1
1
1
1
1
1
1
1
1
1
1
1
1
1
1
1
1
1
1
1
1
1
1
1
1
1
1
1
1
1
1
1
1
1
1
1
1
1
1
1
1
1
1
1
1
1
1
1
1
1
1
1
1
1
1
1
1
1
1
1
1
1
1
1
1
1
1
1
1
1
1
1
1
1
1
1
1
1
1
1
1
1
1
1
1
1
1
1
1
1
1
1
1
1
1
1
1
1
1
1
1
1
1
1
1
1
1
1
1
1
1
1
1
1
1
1
1
1
1
1
1
1
1
1
1
1
1
1
1
1
1
1
1
1
1
1
1
1
1
1
1
1
1
1
1
1
1
1
1
1
1
1
1
1
1
1
1
1
1
1
1
1
1
1
1
1
1
1
1
1
1
1
1
1
1
1
1
1
1
1
1
1
1
1
1
1
1
1
1
1
1
1
1
1
1
1
1
1
1
1
1
1
1
1
1
1
1
1
1
1
1
1
1
1
1
1
1
1
1
1
1
1
1
1
1
1
1
1
1
1
1
1
1
1
1
1
1
1
1
1
1
1
1
1
1
1
1
1
1
1
1
1
1
1
1
1
1
1
1
1
1
1
1
1
1
1
1
1
1
1
1
1
1
1
1
1
1
1
1
1
1
1
1
1
1
1
1
1
1
1
1
1
1
1
1
1
1
1
1
1
1
1
1
1
1
1
1
1
1
1
1
1
1
1
1
1
1
1
1
1
1
1
1
1
1
1
1
1
1
1
1
1
1
1
1
1
1
1
1
1
1
1
1
1
1
1
1
1
1
1
1
1
1
1
1
1
1
1
1
1
1
1
1
1
1
1
1
1
1
1
1
1
1
1
1
1
1
1
1
1
1
1
1
1
1
1
1
1
1
1
1
1
1
1
1
1
1
1
1
1
1
1
1
1
1
1
1
1
1
1
1
1
1
1
1
1
1
1
1
1
1
1
1
1
1
1
1
1
1
1
1
1
1
1
1
1
1
1
1
1
1
1
1
1
1
1
1
1
1
1
1
1
1
1
1
1
1
1
1
1
1
1
1
1
1
1
1
1
1
1
1
1
1
1
1
1
1
1
1
1
1
1
1
1
1
1
1
1
1
1
1
1
1
1
1
1
1
1
1
1
1
1
1
1
1
1
1
1
1
1
1
1
1
1
1
1
1
1
1
1
1
1
1
1
1
1
1
1
1
1
1
1
1
1
1
1
1
1
1
1
1
1
1
1
1
1
1
1
1
1
1
1
1
1
1
1
1
1
1
1
1
1
1
1
1
1
1
1
1
1
1
1
1
1
1
1
1
1
1
1
1
1
1
1
1
1
1
1
1
1
1
1
1
1
1
1
1
1
1
1
1
1
1
1
1
1
1
1
1
1
1
1
1
1
1
1
1
1
1
1
1
1
1
1
1
1
1
1
1
1
1
1
1
1
1
1
1
1
1
1
1
1
1
1
1
1
1
1
1
1
1
1
1
1
1
1
1
1
1
1
1
1
1
1
1
1
1
1
1
1
1
1
1
1
1
1
1
1
1
1
1
1
1
1
1
1
1
1
1
1
1
1
1
1
1
1
1
1
1
1
1
1
1
1
1
1
1
1
1
1
1
1
1
1
1
1
1
1
1
1
1
1
1
1
1
1
1
1
1
1
1
1
1
1
1
1
1
1
1
1
1
1
1
1
1
1
1
1
1
1
1
1
1
1
1
1
1
1
1
1
1
1
1
1
1
1
1
1
1
1
1
1
1
1
1
1
1
1
1
1
1
1
1
1
1
1
1
1
1
1
1
1
1
1
1
1
1
1
1
1
1
1
1
1
1
1
1
1
1
1
1
1
1
1
1
1
1
1
1
1
1
1
1
1
1
1
1
1
1
1
1
1
1
1
1
1
1
1
1
1
1
1
1
1
1
1
1
1
1
1
1
1
1
1
1
1
1
1
1
1
1
1
1
1
1
1
1
1
1
1
1
1
1
1
1
1
1
1
1
1
1
1
1
1
1
1
1
1
1
1
1
1
1
1
1
1
1
1
1
1
1
1
1
1
1
1
1
1
1
1
1
1
1
1
1
1
1
1
1
1
1
1
1
1
1
1
1
1
1
1
1
1
1
1
1
1
1
1
1
1
1
1
1
1
1
1
1
1
1
1
1
1
1
1
1
1
1
1
1
1
1
1
1
1
1
1
1
1
1
1
1
1
1
1
1
1
1
1
1
1
1
1
1
1
1
1
1
1
1
1
1
1
1
1
1
1
1
1
1
1
1
1
1
1
1
1
1
1
1
1
1
1
1
1
1
1
1
1
1
1
1
1
1
1
1
1
1
1
1
1
1
1
1
1
1
1
1
1
1
1
1
1
1
1
1
1
1
1
1
1
1
1
1
1
1
1
1
1
1
1
1
1
1
1
1
1
1
1
1
1
1
1
1
1
1
1
1
1
1
1
1
1
1
1
1
1
1
1
1
1
1
1
1
1
1
1
1
1
1
1
1
1
1
1
1
1
1
1
1
1
1
1
1
1
1
1
1
1
1
1
1
1
1
1
1
1
1
1
1
1
1
1
1
1
1
1
1
1
1
1
1
1
1
1
1
1
1
1
1
1
1
1
1
1
1
1
1
1
1
1
1
1
1
1
1
1
1
1
1
1
1
1
1
1
1
1
1
1
1
1
1
1
1
1
1
1
1
1
1
1
1
1
1
1
1
1
1
1
1
1
1
1
1
1
1
1
1
1
1
1
1
1
1
1
1
1
1
1
1
1
1
1
1
1
1
1
1
1
1
1
1
1
1
1
1
1
1
1
1
1
1
1
1
1
1
1
1
1
1
1
1
1
1
1
1
1
1
1
1
1
1
1
1
1
1
1
1
1
1
1
1
1
1
1
1
1
1
1
1
1
1
1
1
1
1
1
1
1
1
1
1
1
1
1
1
1
1
1
1
1
1
1
1
1
1
1
1
1
1
1
1
1
1
1
1
1
1
1
1
1
1
1
1
1
1
1
1
1
1
1
1
1
1
1
1
1
1
1
1
1
1
1
1
1
1
1
1
1
1
1
1
1
1
1
1
1
1
1
1
1
1
1
1
1
1
1
1
1
1
1
1
1
1
1
1
1
1
1
1
1
1
1
1
1
1
1
1
1
1
1
1
1
1
1
1
1
1
1
1
1
1
1
1
1
1
1
1
1
1
1
1
1
1
1
1
1
1
1
1
1
1
1
1
1
1
1
1
1
1
1
1
1
1
1
1
1
1
1
1
1
1
1
1
1
1
1
1
1
1
1
1
1
1
1
1
1
1
1
1
1
1
1
1
1
1
1
1
1
1
1
1
1
1
1
1
1
1
1
1
1
1
1
1
1
1
1
1
1
1
1
1
1
1
1
1
1
1
1
1
1
1
1
1
1
1
1
1
1
1
1
1
1
1
1
1
1
1
1
1
1
1
1
Publication Years
603
1188
138
1
Category
883
114
108
91
47
22
4
Toolboxes
153
113
109
94
84
77
71
64
53
44
43
34
34
33
24
24
21
14
13
8
8
7
3
2
1
1
1

Further Analysis of the 2000, 2005, 2010, and 2014 Cambodia Demographic and Health Surveys | DHS Further Analysis Reports No. 106

DHS Further Analysis Reports No. 103

DHS Further Analysis Reports No 102
DHS Further Analysis Reports No. 101

DHS Further Analysis Reports No. 97
DHS Further Analysis Reports No. 109 - This report documents trends in key child nutrition indicators in Rwanda. Data from the Demographic and Health Surveys (DHS) in 2005, 2010, and 2014-15 were analyzed, disaggregated by selected equity-related va
...
riables, and tested for trends. Over the survey period, Rwanda had high rates of exclusive breastfeeding, with regional variation. Rates of continued breastfeeding were also high but generally decreased as mother’s education and household wealth increased in all survey years. Complementary feeding practices varied by region, mother’s education, household wealth, urban-rural residence, and sex of the child.
more
DHS Further Analysis Reports No. 108 - This report examines levels, trends, and inequalities in maternal health in Rwanda from 2010 to 2014-15 among women age 15-49 with a recent birth. The analysis uses Demographic and Health Survey (DHS) data for
...
15 key indicators of maternal health: 6 for antenatal care, 3 for delivery, 1 for postnatal care, and 5 for barriers to accessing medical care. Levels and trends in these indicators were analyzed overall and by three background characteristics: women’s education, household wealth quintile, and region.
more
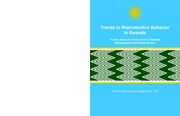
DHS Further Analysis Reports No. 107 - This report, based largely on the 2014-15 national survey in Rwanda, focuses on changes and trends in reproductive behavior since 2010. In the 4-5 years after the 2010 survey, fertility continued its decline to
...
4.2 births per woman as contraceptive prevalence increased slightly. However, the earlier downward trend in number of children desired appears stalled. This is clearly evident from an increase in the proportions of married women and men who say they want more children. Child mortality has significantly declined and remains strongly related to fertility; while age at marriage has continued to increase. The demographic goals specified in the 1998-99 plan for development, Rwanda Vision 2020, appear on track, but the annual rate of population growth remains high, currently 2.5%, because fertility is high. Furthermore, large numbers of young people are now entering their child-bearing years. Although most trends seem encouraging, especially compared with other countries in sub-Saharan Africa, significant population growth is expected in Rwanda, from 12 to 16 million people by 2030, and to 22 million people by mid-century, even with assumed reductions of fertility.
more

Trends in Neonatal Mortality in Rwanda, 2000-2010
Winter, Rebecca, Thomas Pullum, Anne Langston, Ndicunguye V. Mivumbi, Pierre C. Rutayisire, Dieudonne N. Muhoza, and Solange Hakiba
Calverton, Maryland, USA: ICF International.
(2013)
C2
DHS Further Analysis Reports No. 88 - This further analysis examines levels, trends, and determinants of neonatal mortality in Rwanda, using data from the 2000, 2005, and 2010 Rwanda Demographic and Health Surveys (RDHS).

This report provides an update on the level of poverty based on 2013/14 Integrated Household Living Conditions Survey (EICV4) focusing on poverty as measured in consumption terms. The report also hi
...
ghlights other trend dimensions of living conditions captured in other surveys that complement and provide a holistic understanding of poverty and living conditions.
Rwanda’s economy has been growing steadily at about 8% since 2001 with GDP per capita more than tripling from US$ 211 in 2001 to US$ 718 in 2014. Food crop production growth was more than twice that of population growth between 2007 and 2014.
more
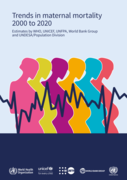
Every day in 2020, approximately 800 women died from preventable causes related to pregnancy and childbirth - meaning that a woman dies around every two minutes.
Sustainable Development Goal (SDG) target 3.1 is to reduce maternal mortality to less than 70 maternal deaths per 100 000 live births by
...
2030.
The United Nations Maternal Mortality Estimation Inter-Agency Group (MMEIG) – comprising WHO, the United Nations Children’s Fund (UNICEF), the United Nations Population Fund (UNFPA), the World Bank Group and the United Nations Department of Economic and Social Affairs, Population Division (UNDESA/Population Division) has collaborated with external technical experts on a new round of estimates covering 2000 to 2020. The estimates represent the most up to date, internationally-comparable MMEIG estimates of maternal mortality, using refined input data and methods from previous rounds.
The report presents internationally comparable global, regional and country-level estimates and trends for maternal mortality between 2000 and 2020.
more
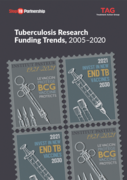
Previous advocacy efforts have achieved tangible goals in terms garnering political commitments
to increase financing for TB—as seen at the 2018 UN High-Level Meeting on TB. The challenge
now is to ensure that these commitments are actually met within a global biomedical research
ecosystem that
...
is designed and incentivized to prioritize the health needs of wealthy populations
more
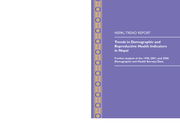
Further analysis of the 1996, 2001, and 2006 Demographic and Health Surveys Data
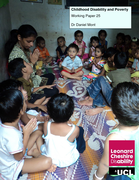
As the Convention of the Rights of Children recognizes, children are human beings with a distinct set of rights, and not the passive objects of care and charity. They deserve to be full participants in society, and to live lives free of poverty. But
...
for children, living in poverty is particularly impactful. The foundations for life are built in childhood. In the early part of our lives, our bodies and brains develop their capacities to function and interact with the world. We learn the social skills we need to fit into society, and acquire the human capital necessary to earn a living, support a family, and to fully take part in the life of our community Poverty can stunt this development. So can the onset of a disability. As the World Report on Disability (WHO/World Bank 2011) points out, people with disabilities are all too often excluded from the economic and social lives of their community. And the interaction between disability and poverty has the potential to develop a vicious circle that can greatly limit life opportunities.
Working Paper Series: No. 25
more
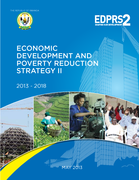
The Second Economic Development and Poverty Reduction Strategy (EDPRS 2) is a launch into the home straight of our Vision 2020. We are faced with new challenges of ensuring greater self-reliance and developing global competitiveness. Conscious of th
...
ese challenges, we forge ahead knowing that by working together, we always overcome. The EDPRS 2 period is the time when our private sector is expected to take the driving seat in economic growth and poverty reduction. Through this strategy we will focus government efforts on transforming the economy, the private sector and alleviating constraints to growth of investment. We will develop the appropriate skills and competencies to allow our people particularly the youth to become more productive and competitive to support our ambitions. We will also strengthen the platform for communities to engage decisively and to continue to develop home grown solutions that have been the bedrock of our success. These are fundamental principles as we work to improve the lives of all Rwandans in the face of an uncertain global economic environment.
more
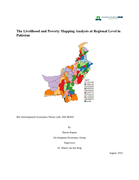
An attempt has been made to map the incidence of uni-dimensional and multi-dimensional poverty simultaneously arguably for the first time in Pakistan. While multi-dimensional poverty map is calculat
...
ed using PSLM 2010-11; small area estimation technique is utilized to map uni-dimensional poverty using both nationally representative HIES (Household Integrated Economic Survey) and district-level representative PSLM (Pakistan Standard of Living Measurement) for the same year of 2010-11. The result indicates the existence of spatial distribution of poverty pockets in each of the four provinces of Pakistan. Furthermore, it is also observed that these pockets of poverty are more concentrated in the desert and mountains regions of the country.
more

Progress in reducing tobacco use is a key indicator for measuring countries’ efforts to implement the WHO Framework Convention on Tobacco Control – target 3.a under the Sustainable Development Goals agenda. Countries have adopted this indicator to report progress also towards the tobacco reducti
...
on target under the Global Action Plan for the Prevention and Control of Noncommunicable Diseases 2013–2020 and the WHO’s Global Programme of Work triple billions target.
Fourth edition.
more

Only 8,730 asylum applications were registered in the EU+ in April, the lowest since at least 2008, and a massive 87% decrease from pre-COVID-19 levels in January and February.
The European Asylum Support Office (EASO) has released a special report which shows that the COVID-19 related travel restr
...
ictions and national health measures which were imposed during the past few months led to a dramatic cut in asylum applications in Europe.
more