Filter
2250
Text search:
demographic
indicators
Featured
118
847
Language
2196
46
35
19
15
12
6
6
2
2
1
1
1
1
1
1
1
Document type
1465
412
139
89
77
21
17
16
8
5
1
Countries
123
107
103
95
81
81
76
71
71
69
66
58
57
55
55
52
38
35
34
31
31
30
29
29
28
25
20
20
19
15
13
13
13
13
11
11
11
10
10
10
9
9
9
9
8
7
7
7
7
6
6
6
6
6
5
5
5
5
5
5
5
4
4
4
4
3
3
3
3
3
3
3
2
2
2
2
2
2
2
2
2
2
2
2
2
1
1
1
1
1
1
1
1
1
1
1
1
1
1
1
1
1
1
1
1
1
1
1
1
1
1
1
1
1
1
1
Authors & Publishers
194
64
57
55
51
49
44
42
30
26
24
22
19
18
18
16
12
12
11
10
10
10
10
10
9
9
9
8
8
8
8
7
7
7
7
7
7
7
7
7
6
6
6
6
6
6
6
6
6
6
6
5
5
5
5
5
5
5
5
5
5
5
5
5
5
5
4
4
4
4
4
4
4
4
4
4
4
4
4
4
4
4
4
4
4
4
4
4
4
4
4
3
3
3
3
3
3
3
3
3
3
3
3
3
3
3
3
3
3
3
3
3
3
3
3
3
3
3
3
3
3
3
3
3
3
3
3
3
3
3
3
3
3
3
3
3
3
3
3
3
3
3
3
3
3
3
3
3
3
3
3
3
3
2
2
2
2
2
2
2
2
2
2
2
2
2
2
2
2
2
2
2
2
2
2
2
2
2
2
2
2
2
2
2
2
2
2
2
2
2
2
2
2
2
2
2
2
2
2
2
2
2
2
2
2
2
2
2
2
2
2
2
2
2
2
2
2
2
2
2
2
2
2
2
2
2
2
2
2
2
2
2
2
2
2
2
2
2
2
2
2
2
2
2
2
2
2
2
2
2
2
2
2
2
2
2
2
2
2
2
2
2
2
2
2
2
2
2
2
2
2
2
2
2
2
2
2
2
2
2
2
2
2
2
2
2
2
2
2
2
2
2
2
2
2
2
2
2
2
2
2
2
2
2
2
2
2
2
1
1
1
1
1
1
1
1
1
1
1
1
1
1
1
1
1
1
1
1
1
1
1
1
1
1
1
1
1
1
1
1
1
1
1
1
1
1
1
1
1
1
1
1
1
1
1
1
1
1
1
1
1
1
1
1
1
1
1
1
1
1
1
1
1
1
1
1
1
1
1
1
1
1
1
1
1
1
1
1
1
1
1
1
1
1
1
1
1
1
1
1
1
1
1
1
1
1
1
1
1
1
1
1
1
1
1
1
1
1
1
1
1
1
1
1
1
1
1
1
1
1
1
1
1
1
1
1
1
1
1
1
1
1
1
1
1
1
1
1
1
1
1
1
1
1
1
1
1
1
1
1
1
1
1
1
1
1
1
1
1
1
1
1
1
1
1
1
1
1
1
1
1
1
1
1
1
1
1
1
1
1
1
1
1
1
1
1
1
1
1
1
1
1
1
1
1
1
1
1
1
1
1
1
1
1
1
1
1
1
1
1
1
1
1
1
1
1
1
1
1
1
1
1
1
1
1
1
1
1
1
1
1
1
1
1
1
1
1
1
1
1
1
1
1
1
1
1
1
1
1
1
1
1
1
1
1
1
1
1
1
1
1
1
1
1
1
1
1
1
1
1
1
1
1
1
1
1
1
1
1
1
1
1
1
1
1
1
1
1
1
1
1
1
1
1
1
1
1
1
1
1
1
1
1
1
1
1
1
1
1
1
1
1
1
1
1
1
1
1
1
1
1
1
1
1
1
1
1
1
1
1
1
1
1
1
1
1
1
1
1
1
1
1
1
1
1
1
1
1
1
1
1
1
1
1
1
1
1
1
1
1
1
1
1
1
1
1
1
1
1
1
1
1
1
1
1
1
1
1
1
1
1
1
1
1
1
1
1
1
1
1
1
1
1
1
1
1
1
1
1
1
1
1
1
1
1
1
1
1
1
1
1
1
1
1
1
1
1
1
1
1
1
1
1
1
1
1
1
1
1
1
1
1
1
1
1
1
1
1
1
1
1
1
1
1
1
1
1
1
1
1
1
1
1
1
1
1
1
1
1
1
1
1
1
1
1
1
1
1
1
1
1
1
1
1
1
1
1
1
1
1
1
1
1
1
1
1
1
1
1
1
1
1
1
1
1
1
1
1
1
1
1
1
1
1
1
1
1
1
1
1
1
1
1
1
1
1
1
1
1
1
1
1
1
1
1
1
1
1
1
1
1
1
1
1
1
1
1
1
1
1
1
1
1
1
1
1
1
1
1
1
1
1
1
1
1
1
1
1
1
1
1
1
1
1
1
1
1
1
1
1
1
1
1
1
1
1
1
1
1
1
1
1
1
1
1
1
1
1
1
1
1
1
1
1
1
1
1
1
1
1
1
1
1
1
1
1
1
1
1
1
1
1
1
1
1
1
1
1
1
1
1
1
1
1
1
1
1
1
1
1
1
1
1
1
1
1
1
1
1
1
1
1
1
1
1
1
1
1
1
1
1
1
1
1
1
1
1
1
1
1
1
1
1
1
1
1
1
1
1
1
1
1
1
1
1
1
1
1
1
1
1
1
1
1
1
1
1
1
1
1
1
1
1
1
1
1
1
1
1
1
1
1
1
1
1
1
1
1
1
1
1
1
1
1
1
1
1
1
1
1
1
1
1
1
1
1
1
1
1
1
1
1
1
1
1
1
1
1
1
1
1
1
1
1
1
1
1
1
1
1
1
1
1
1
1
1
1
1
1
1
1
1
1
1
1
1
1
1
1
1
1
1
1
1
1
1
1
1
1
1
1
1
1
1
1
1
1
1
1
1
1
1
1
1
1
1
1
1
1
1
1
1
1
1
1
1
1
1
1
1
1
1
1
1
1
1
1
1
1
1
1
1
1
1
1
1
1
1
1
1
1
1
1
1
1
1
1
1
1
1
1
1
1
1
1
1
1
1
1
1
1
1
1
1
1
1
1
1
1
1
1
1
1
1
1
1
1
1
1
1
1
1
1
1
1
1
1
1
1
1
1
1
1
1
1
1
1
1
1
1
1
1
1
1
1
1
1
1
1
1
1
1
1
1
1
1
1
1
1
1
1
1
1
1
1
1
1
1
1
1
1
1
1
1
1
1
1
1
1
1
1
1
1
1
1
1
1
1
1
1
1
1
1
1
1
1
1
1
1
1
1
1
1
1
1
1
1
1
1
1
1
1
1
1
1
1
1
1
1
1
1
1
1
1
1
1
1
1
1
1
1
1
1
1
1
1
1
1
1
1
1
1
1
1
1
1
1
1
1
1
1
1
1
1
1
1
1
1
1
1
1
1
1
1
1
1
1
1
1
1
1
1
1
1
1
1
1
1
1
1
1
1
1
1
1
1
1
1
1
1
1
1
1
1
1
1
1
1
1
1
1
1
1
1
1
1
1
1
1
1
1
1
1
1
1
1
1
1
1
1
1
1
1
1
1
1
1
1
1
1
1
1
1
1
1
1
1
1
1
1
1
1
1
1
1
1
1
1
1
1
1
1
1
1
1
1
1
1
1
1
1
1
1
1
1
1
1
1
1
1
1
1
1
1
1
1
1
1
1
1
1
1
1
1
1
1
1
1
1
1
1
1
1
1
1
1
1
1
1
1
1
1
1
1
1
1
1
1
1
1
1
1
1
1
1
1
1
1
1
1
1
1
1
1
1
1
1
1
1
1
1
1
1
1
1
1
1
1
1
1
1
1
1
1
1
1
1
1
1
1
1
1
1
1
1
1
1
1
1
1
1
1
1
1
1
1
1
1
1
1
1
1
1
1
1
1
1
1
1
1
1
1
1
1
1
1
1
1
1
1
1
1
1
1
1
1
1
1
1
1
1
1
1
1
1
1
1
1
1
1
1
1
1
1
1
1
1
1
1
1
1
1
1
1
1
1
1
1
1
1
1
1
1
1
1
1
1
1
1
1
1
1
1
1
1
1
1
1
1
1
1
1
1
1
1
1
1
1
1
1
1
1
1
1
1
1
1
1
1
1
1
1
1
1
1
1
1
1
1
1
1
1
1
1
1
1
1
1
1
1
1
1
1
1
1
1
1
1
1
1
1
1
1
1
1
1
1
1
1
1
1
1
1
1
1
1
1
1
1
1
1
1
1
1
1
1
1
1
1
1
1
1
1
1
1
1
1
1
1
1
1
1
1
1
1
1
1
1
1
1
1
1
1
1
1
1
1
1
1
1
1
1
1
1
1
1
1
1
1
1
1
1
1
1
1
1
1
1
1
1
1
1
1
1
1
1
1
1
1
1
1
1
1
1
1
1
1
1
1
1
1
1
1
1
1
1
1
1
1
1
1
1
1
1
1
1
1
1
1
1
1
1
1
1
1
1
1
1
1
1
1
1
1
1
1
1
1
1
1
1
1
1
1
1
1
1
1
1
1
1
1
1
1
1
1
1
1
1
1
1
1
1
1
1
1
1
1
1
1
1
1
1
1
1
1
1
1
1
1
1
1
1
1
1
1
1
1
1
1
1
1
1
1
1
1
1
1
1
1
1
1
1
1
1
1
1
1
1
1
1
1
1
1
1
1
1
1
1
1
1
1
1
1
1
1
1
1
1
1
1
1
1
1
1
1
1
1
1
1
1
1
1
1
1
1
1
1
1
1
1
1
1
1
1
1
1
1
1
1
1
1
1
1
1
1
1
1
1
1
1
1
1
1
1
1
1
1
1
1
1
1
1
1
1
1
1
1
1
1
1
1
1
1
1
1
1
1
1
1
1
1
1
1
1
1
1
1
1
1
1
1
1
1
1
1
1
1
Publication Years
492
1571
183
3
1
Category
1421
121
114
110
75
18
6
Toolboxes
99
84
74
68
58
45
40
40
36
33
32
31
29
26
25
21
19
18
13
11
10
10
3
2
1
Version-1, June 2018
This document provides 3MDG stakeholders with essential information on SRHR indicators, derived from the 3MDG Logical Framework, Data Dictionary for Health Service Indicators ... (2014 June, DoPH, MoHA), A Guide to Monitoring and Evaluating Adolescent Reproductive Health Programs (MEASURE Evaluation, June 2000) and Monitoring National Cervical Cancer Prevention and Control Programmes (WHO, PAHO, 2013). Partners are strongly encouraged to integrate the SRHR indicators into their ongoing monitoring and evaluation (M&E) activities.
These indicators are designed to help partners assess the current state of their activities, their progress towards achieving their targets, and contribution towards the national response. This guideline is designed to improve the quality and consistency of data collected at the township level, which will enhance the accuracy of conclusions drawn when the data are aggregated. more
Thefirst report on Latin America and the Carribean presents key indicators on health and health systems in 33 Latin America and the Caribbean countries. . Analysis is based on the latest comparable data across almost 100
...
indicators including equity, health status, determinants of health, health care resources and utilisation, health expenditure and financing, and quality of care. The editorial discusses the main challenges for the region brought by the COVID-19 pandemic, such as managing the outbreak as well as mobilising adequate resources and using them efficiently to ensure an effective response to the epidemic.
more
his publication provides an overview of social inequalities in several indicators related to the health of women, children, and adolescents in a region deemed as one with high levels of inequality: Latin America and the Caribbean (LAC). In order for
...
it to serve as a baseline for the 2030 Agenda, emphasis is placed on examining these inequalities around the year 2014. The analysis suggests that reducing within-country disparities is a priority, as widespread social inequalities in health are identified among LAC countries.
more
We combine data on Chinese development projects with data from Demographic and Health Surveys to study the impact of Chinese aid on household welfare in sub-Saharan Africa. We use a novel methodology to test the effect of Chinese aid on three import
...
ant development outcomes: education, health, and nutrition. For each outcome, we use difference-in-difference estimations to compare household areas near Chinese project sites to control areas located farther away, before and after receiving Chinese aid. This empirical strategy rules out many confounding factors that can bias measuring the impact of Chinese aid on our outcome variables. First, we find that Chinese projects significantly improve education and child mortality in treatment areas, but do not significantly affect nutrition. Second, social sector projects have a larger effect on outcomes than economic projects. Third, we do not find significant effects for projects that ended more than five years before the post-treatment survey wave. Our results are robust to a host of robustness checks.
more

The 2024 edition reviews more than 50 health-related indicators from the Sustainable Development Goals and WHO’s Thirteenth General Programme of Work. It also highlights the findings from the Global health estimates 2021, notably the impact of the
...
COVID-19 pandemic on life expectancy and healthy life expectancy.
more

Further Analysis of the 2000, 2005, 2010, and 2014 Cambodia Demographic and Health Surveys | DHS Further Analysis Reports No. 106
The 2013 RMIS is a nationally representative, household-based survey that provides data on malaria indicators, which are used to assess the progress of a malaria control program. The primary objective of the 2013 Rwanda Malaria Indicator Survey (201
...
3 RMIS) was to provide up-to date information on the prevention of malaria to policymakers, planners, and researchers.
more
DHS Methodological Report No. 20
This study used Service Provision Assessment (SPA) and Demographic and Health Survey (DHS) data from Haiti, Malawi, and Tanzania to compare traditionally used additive methods with a data reduction method— ... principal component analysis (PCA).
We scored the quality of health facilities with three approaches (simple additive, weighted additive, and PCA) for two constructs: quality of services, with only facilities-level data, and quality of care, which incorporates observation and client data. We ranked facilities as high, medium, or low quality based on their scores. Our results indicated that the rankings change with the scoring methodology. There was more consistency in the rankings of facilities by the simple additive and PCA methods than the weighted additive and PCA-based rankings. This may be due to the low factor loadings and little variance explained by the first component in the PCA. We aggregated facility scores to their respective DHS clusters (Haiti, Malawi) or regions (Tanzania) and geographically linked them to women interviewed in DHS surveys to test associations between the use of family planning services and the quality environment, as measured with each index. more
Census Report Volume 4-C
The 2014 Myanmar Census provided the opportunity to measure maternal mortality. The questions on deaths in households during the twelve months prior to the Census were included in the questionnaire, as well as questions necessary to estimate maternal mortality ... indicators. more
The 2014 Myanmar Census provided the opportunity to measure maternal mortality. The questions on deaths in households during the twelve months prior to the Census were included in the questionnaire, as well as questions necessary to estimate maternal mortality ... indicators. more
Version 2, January 2016
The primary purpose of this document is to provide 3MDG stakeholders with some essential information on the MNCH core-indicators for 3MDG, which were derived from the 3MDG Logical Framework, Data Dictionary for Health S ... ervice Indicators (2014 June, DoPH, MoH), A Guide for Monitoring and Evaluating Child Health Programmes (MEASURE Evaluation, September 2005) and Monitoring Emergency Obstetric Care (WHO/UNICEF/UNFPA/AMDD). Partners are strongly encouraged to integrate the MNCH indicators into their ongoing monitoring and evaluation (M&E) activities.
These indicators are designed to help Partners assess the current state of their activities, their progress towards achieving their targets, and contribution towards the national response. This guideline is designed to improve the quality and consistency of data collected at the township level, which will enhance the accuracy of conclusions drawn when the data are aggregated. more

Accessed on 03.03.2020
The country recognizes the importance of family planning as they focus on achieving a demographic dividend. In order to improve the service delivery and supply chain, Senegal is strengthening its data management and reporting
...
. Domestic resource mobilization for family planning remains a key challenges for Senegal.
more
This document aims to describe a minimum set of surveillance activities recommended at the national level to detect and monitor the relative prevalence of SARS-CoV-2 variants and outline a set of activities for the characterization and assessment of risk posed by these variants. A set of
...
indicators is also provided to standardize monitoring and public reporting of variant circulation.
The document is primarily intended for national and sub-national public health authorities and partners who support implementation of surveillance for SARS-CoV-2 variants
more
Census Report Volume 4-E
As no census has been undertaken in over 30 years, many aspects of the demographic situation in the country were unknown. For instance, before the Census it was thought that the country had a population of about 60 mill ... ion, but the 2014 Census showed that the population (including an estimate for under-enumeration) was 51,486,253 persons, around 8.5 million less than the previous estimate.
In the 1983 census, 35,307,913 persons were recorded. Therefore between 1983 and 2014, the population increased by 46 per cent. With an average annual population growth rate of 0.89 per cent between 2003 and 2014, Myanmar is one of the slowest growing countries in Southeast Asia. more
Measuring progress towards universal health coverage.
This sixth edition of Health at a Glance Asia/Pacific presents a set of key indicators of health status, the determinants of health, health care resources and utilisation, health care expenditur
...
e and financing and quality of care across 27 Asia-Pacific countries and territories. It also provides a series of dashboards to compare performance across countries and territories, and a thematic analysis on the impact of the COVID-19 outbreak on Asia/Pacific health systems.
more
2018 monitoring report: current status and strategic priorities
The report sets out the status of women’s, children’s and adolescents’ health, and on health systems and social and environmental determinants. Regional dashboards on 16 key indicat ... ors highlight where progress is being made or lagging. There is progress overall, but not at the level required to achieve the 2030 goals. There are some areas where progress has stalled or is reversing, namely neonatal mortality, gender inequalities and health in humanitarian settings. more
The report sets out the status of women’s, children’s and adolescents’ health, and on health systems and social and environmental determinants. Regional dashboards on 16 key indicat ... ors highlight where progress is being made or lagging. There is progress overall, but not at the level required to achieve the 2030 goals. There are some areas where progress has stalled or is reversing, namely neonatal mortality, gender inequalities and health in humanitarian settings. more
This year marked the beginning of the WHO biennium 2016-2017 action plan; this annual report highlights WHO’s key achievements in 2016
It also documents the extraordinary efforts by a broad coalition of government ministries, municipalities, international agencies, community groups, women’s or
...
ganizations, religious and traditional leaders, media, private sector and donors towards restoration and improving health indicators.
more

Joint data assessment by the Central Statistical Organization and UNDP
The report shows that the National Statistical System of Myanmar has some work ahead of it in terms of preparing for the monitoring of the SDG indicators. Only 44 of the SDG ... indicators are currently produced and readily available at the national level. However, the good news is that many (97) of the missing indicators can be computed from existing data sources – often with little effort - and don’t require any additional data collection. The report concludes that Myanmar is in a decent position to start monitoring the SDGs, and should start as soon as possible in putting its existing data to full use for the SDGs. more
The report shows that the National Statistical System of Myanmar has some work ahead of it in terms of preparing for the monitoring of the SDG indicators. Only 44 of the SDG ... indicators are currently produced and readily available at the national level. However, the good news is that many (97) of the missing indicators can be computed from existing data sources – often with little effort - and don’t require any additional data collection. The report concludes that Myanmar is in a decent position to start monitoring the SDGs, and should start as soon as possible in putting its existing data to full use for the SDGs. more
Inequalities in maternal health care utilization in Benin: a population based cross-sectional study
Sanni Yaya , Olalekan A. Uthman, Agbessi Amouzou, Michael Ekholuenetale, Ghose Bishwajit
BMC Pregnancy and Childbirth
(2018)
C2
Yaya et al. BMC Pregnancy and Childbirth (2018) 18:194
Ensuring equitable access to maternal health care including antenatal, delivery, postnatal services
and fertility control methods, is one of the most critical challenges for public health sector. There are significant
disparities in materna
...
l health care indicators across many geographical locations, maternal, economic, sociodemographic
factors in many countries in sub-Sahara Africa. In this study, we comparatively explored the utilization
level of maternal health care, and examined disparities in the determinants of major maternal health outcomes
more
This report presents further analysis of the 2015 Nepal Health Facility Survey. Data analysis is based on the Donabedian framework for assessing quality of care in health services, which divides the indicators into three groups: structure, process,
...
and outcome. The World Health Organization Service Availability and Readiness Assessment (SARA) indicator guideline was used to assess facility service readiness, service quality and client satisfaction with maternal health services. The study performed both bivariate and multivariate regression analysis to examine the association of maternal health service readiness and quality indicators with client satisfaction.
more
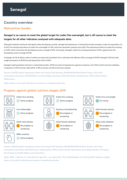
Senegal is on course to meet the global target for under-five overweight, but is off course to meet the targets for all other indicators analysed with adequate data.