Filter
3200
Text search:
maps
Featured
384
767
Language
3135
91
75
46
31
29
23
7
5
4
4
3
3
3
2
2
2
2
2
2
2
1
1
1
1
1
1
1
1
1
1
1
1
1
1
1
1
1
1
1
Document type
1329
723
506
280
156
85
36
33
20
17
5
4
2
1
Countries
202
81
63
60
54
52
51
48
45
43
43
42
42
39
34
34
33
28
26
25
24
24
23
22
22
22
21
20
19
18
18
17
17
16
15
13
13
13
12
11
11
11
11
10
10
9
9
8
8
8
7
7
7
6
6
6
6
6
6
6
5
5
5
5
5
5
5
4
4
4
4
4
4
3
3
3
3
3
3
3
3
3
3
3
2
2
2
2
2
2
2
2
2
2
2
2
2
2
2
2
2
2
2
2
2
2
2
2
2
2
2
1
1
1
1
1
1
1
1
1
1
1
1
1
1
1
1
1
1
1
1
1
1
1
1
1
1
Authors & Publishers
936
313
168
154
94
85
65
54
32
29
20
20
19
19
16
14
14
13
13
13
12
12
11
10
9
9
8
8
8
8
8
8
8
8
8
8
8
7
7
7
7
7
6
6
6
6
5
5
5
5
5
5
5
5
5
5
5
5
5
5
5
4
4
4
4
4
4
4
4
4
4
4
4
4
4
4
4
4
4
4
4
4
4
4
4
4
4
4
4
4
4
4
4
4
3
3
3
3
3
3
3
3
3
3
3
3
3
3
3
3
3
3
3
3
3
3
3
3
3
3
3
3
3
3
3
3
3
3
3
2
2
2
2
2
2
2
2
2
2
2
2
2
2
2
2
2
2
2
2
2
2
2
2
2
2
2
2
2
2
2
2
2
2
2
2
2
2
2
2
2
2
2
2
2
2
2
2
2
2
2
2
2
2
2
2
2
2
2
2
2
2
2
2
2
2
2
2
2
2
2
2
2
2
2
2
2
2
2
2
2
2
2
2
2
2
2
2
2
2
2
2
2
2
2
2
2
2
2
2
2
2
2
2
2
2
2
2
2
2
2
2
2
2
2
2
2
2
2
2
1
1
1
1
1
1
1
1
1
1
1
1
1
1
1
1
1
1
1
1
1
1
1
1
1
1
1
1
1
1
1
1
1
1
1
1
1
1
1
1
1
1
1
1
1
1
1
1
1
1
1
1
1
1
1
1
1
1
1
1
1
1
1
1
1
1
1
1
1
1
1
1
1
1
1
1
1
1
1
1
1
1
1
1
1
1
1
1
1
1
1
1
1
1
1
1
1
1
1
1
1
1
1
1
1
1
1
1
1
1
1
1
1
1
1
1
1
1
1
1
1
1
1
1
1
1
1
1
1
1
1
1
1
1
1
1
1
1
1
1
1
1
1
1
1
1
1
1
1
1
1
1
1
1
1
1
1
1
1
1
1
1
1
1
1
1
1
1
1
1
1
1
1
1
1
1
1
1
1
1
1
1
1
1
1
1
1
1
1
1
1
1
1
1
1
1
1
1
1
1
1
1
1
1
1
1
1
1
1
1
1
1
1
1
1
1
1
1
1
1
1
1
1
1
1
1
1
1
1
1
1
1
1
1
1
1
1
1
1
1
1
1
1
1
1
1
1
1
1
1
1
1
1
1
1
1
1
1
1
1
1
1
1
1
1
1
1
1
1
1
1
1
1
1
1
1
1
1
1
1
1
1
1
1
1
1
1
1
1
1
1
1
1
1
1
1
1
1
1
1
1
1
1
1
1
1
1
1
1
1
1
1
1
1
1
1
1
1
1
1
1
1
1
1
1
1
1
1
1
1
1
1
1
1
1
1
1
1
1
1
1
1
1
1
1
1
1
1
1
1
1
1
1
1
1
1
1
1
1
1
1
1
1
1
1
1
1
1
1
1
1
1
1
1
1
1
1
1
1
1
1
1
1
1
1
1
1
1
1
1
1
1
1
1
1
1
1
1
1
1
1
1
1
1
1
1
1
1
1
1
1
1
1
1
1
1
1
1
1
1
1
1
1
1
1
1
1
1
1
1
1
1
1
1
1
1
1
1
1
1
1
1
1
1
1
1
1
1
1
1
1
1
1
1
1
1
1
1
1
1
1
1
1
1
1
1
1
1
1
1
1
1
1
1
1
1
1
1
1
1
1
1
1
1
1
1
1
1
1
1
1
1
1
1
1
1
1
1
1
1
1
1
1
1
1
1
1
1
1
1
1
1
1
1
1
1
1
1
1
1
1
1
1
1
1
1
1
1
1
1
1
1
1
1
1
1
1
1
1
1
1
1
1
1
1
1
1
1
1
1
1
1
1
1
1
1
1
1
1
1
1
1
1
1
1
1
1
1
1
1
1
1
1
1
1
1
1
1
1
1
1
1
1
1
1
1
1
1
1
1
1
1
1
1
1
1
1
1
1
1
1
1
1
1
1
1
1
1
1
1
1
1
1
1
1
1
1
1
1
1
1
1
1
1
1
1
1
1
1
1
1
1
1
1
1
1
1
1
1
1
1
1
1
1
1
1
1
1
1
1
1
1
1
1
1
1
1
1
1
1
1
1
1
1
1
1
1
1
1
1
1
1
1
1
1
1
1
1
1
1
1
1
1
1
1
1
1
1
1
1
1
1
1
1
1
1
1
1
1
1
1
1
1
1
1
1
1
1
1
1
1
1
1
1
1
1
1
1
1
1
1
1
1
1
1
1
1
1
1
1
1
1
1
1
1
1
1
1
1
1
1
1
1
1
1
1
1
1
1
1
1
1
1
1
1
1
1
1
1
1
1
1
1
1
1
1
1
1
1
1
1
1
1
1
1
1
1
1
1
1
1
1
1
1
1
1
1
1
1
1
1
1
1
1
1
1
1
1
1
1
1
1
1
1
1
1
1
1
1
1
1
1
1
1
1
1
1
1
1
1
1
1
1
1
1
1
1
1
1
1
1
1
1
1
1
1
1
1
1
1
1
1
1
1
1
1
1
1
1
1
1
1
1
1
1
1
1
1
1
1
1
1
1
1
1
1
1
1
1
1
1
1
1
1
1
1
1
1
1
1
1
1
1
1
1
1
1
1
1
1
1
1
1
1
1
1
1
1
1
1
1
1
1
1
1
1
1
1
1
1
1
1
1
1
1
1
1
1
1
1
1
1
1
1
1
1
1
1
1
1
1
1
1
1
1
1
1
1
1
1
1
1
1
1
1
1
1
1
1
1
1
1
1
1
1
1
1
1
1
1
1
1
1
1
1
1
1
1
1
1
1
1
1
1
1
1
1
1
1
1
1
1
1
1
1
1
1
1
1
1
1
1
1
1
1
1
1
1
1
1
1
1
1
1
1
1
1
1
1
1
1
1
1
1
1
1
1
1
1
1
1
1
1
1
1
1
1
1
1
1
1
1
1
1
1
1
1
1
1
1
1
1
1
1
1
1
1
1
1
1
1
1
1
1
1
1
1
1
1
1
1
1
1
1
1
1
1
1
1
1
1
1
1
1
1
1
1
1
1
1
1
1
1
1
1
1
1
1
1
1
1
1
1
1
1
1
1
1
1
1
1
1
1
1
1
1
1
1
1
1
1
1
1
1
1
1
1
1
1
1
1
1
1
1
1
1
1
1
1
1
1
1
1
1
1
1
1
1
1
1
1
1
1
1
1
1
1
1
1
1
1
1
1
1
1
1
1
1
1
1
1
1
1
1
1
1
1
1
1
1
1
1
1
1
1
1
1
1
1
1
1
1
1
1
1
1
1
1
1
1
1
1
1
1
1
1
1
1
1
1
1
1
1
1
1
1
1
1
1
1
1
1
1
1
1
1
1
1
1
1
1
1
1
1
1
1
1
1
1
1
1
1
1
1
1
1
1
1
1
1
1
1
1
1
1
1
1
1
1
1
1
1
1
1
1
1
1
1
1
1
1
1
1
1
1
1
1
1
1
1
1
1
1
1
1
1
1
1
1
1
1
1
1
1
1
1
1
1
1
1
1
1
1
1
1
1
1
1
1
1
1
1
1
1
1
1
1
1
1
1
1
1
1
1
1
1
1
1
1
1
1
1
1
1
1
1
1
1
1
1
1
1
1
1
1
1
1
1
1
1
1
1
1
1
1
1
1
1
1
1
1
1
1
1
1
1
1
1
1
1
1
1
1
1
1
1
1
1
1
1
1
1
1
1
1
1
1
1
1
1
1
1
1
1
1
1
1
1
1
1
1
1
1
1
1
1
1
1
1
1
1
1
1
1
1
1
1
1
1
1
1
1
1
1
1
1
1
1
1
1
1
1
1
1
1
1
1
1
1
1
1
1
1
1
1
1
1
1
1
1
1
1
1
1
1
1
1
1
1
1
1
1
1
1
1
1
1
1
1
1
1
1
1
1
1
1
1
1
1
1
1
1
1
1
1
1
1
1
1
1
1
1
1
1
1
1
1
1
1
1
1
1
1
1
1
1
1
1
1
1
1
1
1
1
1
1
1
1
1
1
1
1
1
1
1
1
1
1
1
1
1
1
1
1
1
1
1
1
1
1
1
1
1
1
1
1
1
1
1
1
1
1
1
1
1
1
1
1
1
1
1
1
1
1
1
1
1
1
1
1
1
1
1
1
1
1
1
Publication Years
1229
1719
243
8
1
Category
736
381
287
275
257
88
69
Toolboxes
216
198
193
192
189
114
110
107
104
104
103
93
81
78
67
67
63
56
52
43
39
30
29
23
3
2
2
The Emergency Response Coordination Centre (ERCC) Portal of the European Civil Protection and Humanitarian Aid Operations includes Daily Maps, Base maps, Satellite
...
Maps and Situation Maps.
more
Tuberculosis (TB) Maps Dashboard
recommended
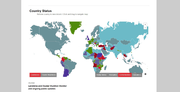
Landmine and Cluster Munition Monitor: Interactive Maps
International Campaign to Ban Landmines
(2018)
C3
Monitor interactive maps present treaty status, stockpiles, contamination, and casualties data on landmines and cluster munitions, primarily based on the latest Monitor annual reports.

7 Stages
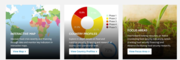
Our global and regional maps provide a visual depiction of the locations around the world where different nutrition-related public health policies have been passed or implemented. The sugary drink tax map includes brief descriptions of over 50 taxes
...
now passed globally, and the front-of-package labeling map provides images of the different label types used worldwide and includes brief policy descriptions for mandatory label policies.
more
Each year 1–2 million people are diagnosed with a tropical disease called leishmaniasis, which is caused by single-celled parasites. People are infected when they are bitten by sandflies carrying the parasite, and often develop skin lesions around the bite site. Though mild cases may recover on th
...
eir own or with treatment, sometimes the parasites multiply and spread elsewhere causing further skin lesions and facial disfigurement. Furthermore, the parasites can also infect internal organs such as the spleen and the liver, which without treatment can be fatal.
more

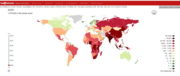
Existing data on chronic obstructive pulmonary disease (COPD) prevalence are irregularly distributed around the world, and in many geographic regions data are scarce or even nonexistent. This fact hinders the implementation of adequate preventive and therapeutic interventions to reduce the high burd
...
en and costs of COPD. In the current study, we have used the Geographic Information System (GIS) inverse distance weighted (IDW) interpolation technique with the objective of visualising spatial data of COPD prevalence in the world and obtaining a visual impression of the magnitude of this global health problem. GIS has been recognised as an effective tool to display the geographical distribution of data, even when they are few and widely separated, as is the case with the prevalence of COPD.
more

Data presentation is the basis for describing data and generating hypotheses for further testing. It consists of a number of methods for summarising data in order to support the identification of patterns. Data can be summarised in a number of forms, including tables or graphical representations s
...
uch as graphs or maps. Effective data presentation requires an understanding of the principles introduced in this guide.
more

Global Food and Nutrition Security Dashboard
recommended
Interactive maps; country profiles and Studies
The Dashboard is designed to consolidate and present up-to-date data on food crisis severity, track global food security financing, and make available global and country-level research and analysis to
...
improve coordination of the policy and financial response to the crisis.
It will bring together disparate and vast information on food security into one place, to help reduce transaction costs, improve transparency, and strengthen analysis. It can also help speed up financing by highlighting funding needs and gaps. The goal is to inform a coordinated global food crisis response while also helping to advance medium to long-term food security interventions.
more
Database with maps and country-specific numbers

Ebola Map Catalog
OCHA
(2014)
Please find the latest maps on the website http://mapcatalog.ocharowca.info/ebola/
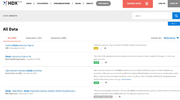
HDX Datasets for Ebola
recommended
Humanitarian Data Exchange
(2014)
Please find here the latest maps, excel sheets or data sets https://data.hdx.rwlabs.org/dataset?q=ebola

OCHA Situation Reports & Updates Ukraine
recommended
Please find here the latest updates & maps

The Global Health Observatory map gallery includes an extensive list of maps on major health topics.
Accessed 26 February 2019.
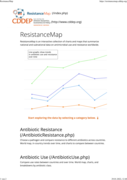
ResitanceMap
recommended
ResistanceMap is an interactive collection of charts and maps that summarize national and subnational data on antimicrobial use and resistance worldwide.

Situation Reports; Maps and Infographics, Reports, Humanitarin Appeals