Filter
4411
Text search:
poverty
Featured
260
1219
Language
4217
125
118
61
58
30
25
25
6
6
5
5
4
4
4
3
3
3
2
2
2
2
2
2
2
2
2
2
2
2
1
1
1
1
1
1
1
1
1
1
1
1
1
1
1
1
1
1
Document type
2523
1038
281
194
168
78
57
32
12
12
7
5
3
1
Countries
259
171
135
113
108
105
98
91
88
86
85
82
77
77
73
71
70
65
62
54
48
45
42
40
38
37
34
32
32
31
28
27
27
25
24
24
24
24
22
22
21
20
19
19
18
17
17
16
16
15
15
15
14
14
12
12
11
11
10
9
9
9
8
8
8
8
7
7
7
7
6
6
5
5
5
4
4
4
4
4
3
3
3
3
3
3
3
3
3
3
3
3
3
2
2
2
2
2
2
2
2
2
2
2
2
2
2
1
1
1
1
1
1
1
1
1
1
1
1
1
1
1
1
1
1
1
1
1
1
1
1
1
1
1
1
1
1
1
1
1
Authors & Publishers
343
151
124
108
98
94
58
48
47
44
38
35
33
30
24
24
23
23
22
21
20
20
20
19
18
18
16
16
16
15
15
14
14
14
14
14
14
14
14
13
13
13
13
12
11
11
11
11
11
11
11
11
11
11
11
11
10
10
10
10
10
9
9
9
9
9
9
9
9
9
9
9
8
8
8
8
8
7
7
7
7
7
7
7
7
7
7
6
6
6
6
6
6
6
6
6
6
6
6
6
6
6
6
6
6
6
6
6
6
6
6
6
5
5
5
5
5
5
5
5
5
5
5
5
5
5
5
5
5
5
5
5
5
5
5
5
5
5
5
5
4
4
4
4
4
4
4
4
4
4
4
4
4
4
4
4
4
4
4
4
4
4
4
4
4
4
4
4
4
4
4
4
4
4
4
4
4
4
4
4
4
4
4
4
4
4
4
4
3
3
3
3
3
3
3
3
3
3
3
3
3
3
3
3
3
3
3
3
3
3
3
3
3
3
3
3
3
3
3
3
3
3
3
3
3
3
3
3
3
3
3
3
3
3
3
3
3
3
3
3
3
3
3
3
3
3
3
3
3
3
3
3
3
3
3
3
3
3
3
3
3
3
3
3
3
3
3
3
3
3
3
3
3
3
3
3
3
3
3
3
3
2
2
2
2
2
2
2
2
2
2
2
2
2
2
2
2
2
2
2
2
2
2
2
2
2
2
2
2
2
2
2
2
2
2
2
2
2
2
2
2
2
2
2
2
2
2
2
2
2
2
2
2
2
2
2
2
2
2
2
2
2
2
2
2
2
2
2
2
2
2
2
2
2
2
2
2
2
2
2
2
2
2
2
2
2
2
2
2
2
2
2
2
2
2
2
2
2
2
2
2
2
2
2
2
2
2
2
2
2
2
2
2
2
2
2
2
2
2
2
2
2
2
2
2
2
2
2
2
2
2
2
2
2
2
2
2
2
2
2
2
2
2
2
2
2
2
2
2
2
2
2
2
2
2
2
2
2
2
2
2
2
2
2
2
2
2
2
2
2
2
2
2
2
2
2
2
2
2
2
2
2
2
2
2
2
2
2
2
2
2
2
2
2
2
2
2
2
2
2
2
2
2
2
2
2
2
2
2
2
2
2
2
2
2
2
2
2
2
2
2
2
2
2
2
2
2
2
2
2
2
2
2
2
2
2
2
2
2
2
2
2
2
2
2
2
2
2
2
2
2
2
2
2
2
2
2
2
2
2
2
2
2
2
2
2
2
2
2
2
2
2
2
2
2
2
2
2
2
2
2
2
2
2
2
2
2
2
2
2
2
2
2
2
2
1
1
1
1
1
1
1
1
1
1
1
1
1
1
1
1
1
1
1
1
1
1
1
1
1
1
1
1
1
1
1
1
1
1
1
1
1
1
1
1
1
1
1
1
1
1
1
1
1
1
1
1
1
1
1
1
1
1
1
1
1
1
1
1
1
1
1
1
1
1
1
1
1
1
1
1
1
1
1
1
1
1
1
1
1
1
1
1
1
1
1
1
1
1
1
1
1
1
1
1
1
1
1
1
1
1
1
1
1
1
1
1
1
1
1
1
1
1
1
1
1
1
1
1
1
1
1
1
1
1
1
1
1
1
1
1
1
1
1
1
1
1
1
1
1
1
1
1
1
1
1
1
1
1
1
1
1
1
1
1
1
1
1
1
1
1
1
1
1
1
1
1
1
1
1
1
1
1
1
1
1
1
1
1
1
1
1
1
1
1
1
1
1
1
1
1
1
1
1
1
1
1
1
1
1
1
1
1
1
1
1
1
1
1
1
1
1
1
1
1
1
1
1
1
1
1
1
1
1
1
1
1
1
1
1
1
1
1
1
1
1
1
1
1
1
1
1
1
1
1
1
1
1
1
1
1
1
1
1
1
1
1
1
1
1
1
1
1
1
1
1
1
1
1
1
1
1
1
1
1
1
1
1
1
1
1
1
1
1
1
1
1
1
1
1
1
1
1
1
1
1
1
1
1
1
1
1
1
1
1
1
1
1
1
1
1
1
1
1
1
1
1
1
1
1
1
1
1
1
1
1
1
1
1
1
1
1
1
1
1
1
1
1
1
1
1
1
1
1
1
1
1
1
1
1
1
1
1
1
1
1
1
1
1
1
1
1
1
1
1
1
1
1
1
1
1
1
1
1
1
1
1
1
1
1
1
1
1
1
1
1
1
1
1
1
1
1
1
1
1
1
1
1
1
1
1
1
1
1
1
1
1
1
1
1
1
1
1
1
1
1
1
1
1
1
1
1
1
1
1
1
1
1
1
1
1
1
1
1
1
1
1
1
1
1
1
1
1
1
1
1
1
1
1
1
1
1
1
1
1
1
1
1
1
1
1
1
1
1
1
1
1
1
1
1
1
1
1
1
1
1
1
1
1
1
1
1
1
1
1
1
1
1
1
1
1
1
1
1
1
1
1
1
1
1
1
1
1
1
1
1
1
1
1
1
1
1
1
1
1
1
1
1
1
1
1
1
1
1
1
1
1
1
1
1
1
1
1
1
1
1
1
1
1
1
1
1
1
1
1
1
1
1
1
1
1
1
1
1
1
1
1
1
1
1
1
1
1
1
1
1
1
1
1
1
1
1
1
1
1
1
1
1
1
1
1
1
1
1
1
1
1
1
1
1
1
1
1
1
1
1
1
1
1
1
1
1
1
1
1
1
1
1
1
1
1
1
1
1
1
1
1
1
1
1
1
1
1
1
1
1
1
1
1
1
1
1
1
1
1
1
1
1
1
1
1
1
1
1
1
1
1
1
1
1
1
1
1
1
1
1
1
1
1
1
1
1
1
1
1
1
1
1
1
1
1
1
1
1
1
1
1
1
1
1
1
1
1
1
1
1
1
1
1
1
1
1
1
1
1
1
1
1
1
1
1
1
1
1
1
1
1
1
1
1
1
1
1
1
1
1
1
1
1
1
1
1
1
1
1
1
1
1
1
1
1
1
1
1
1
1
1
1
1
1
1
1
1
1
1
1
1
1
1
1
1
1
1
1
1
1
1
1
1
1
1
1
1
1
1
1
1
1
1
1
1
1
1
1
1
1
1
1
1
1
1
1
1
1
1
1
1
1
1
1
1
1
1
1
1
1
1
1
1
1
1
1
1
1
1
1
1
1
1
1
1
1
1
1
1
1
1
1
1
1
1
1
1
1
1
1
1
1
1
1
1
1
1
1
1
1
1
1
1
1
1
1
1
1
1
1
1
1
1
1
1
1
1
1
1
1
1
1
1
1
1
1
1
1
1
1
1
1
1
1
1
1
1
1
1
1
1
1
1
1
1
1
1
1
1
1
1
1
1
1
1
1
1
1
1
1
1
1
1
1
1
1
1
1
1
1
1
1
1
1
1
1
1
1
1
1
1
1
1
1
1
1
1
1
1
1
1
1
1
1
1
1
1
1
1
1
1
1
1
1
1
1
1
1
1
1
1
1
1
1
1
1
1
1
1
1
1
1
1
1
1
1
1
1
1
1
1
1
1
1
1
1
1
1
1
1
1
1
1
1
1
1
1
1
1
1
1
1
1
1
1
1
1
1
1
1
1
1
1
1
1
1
1
1
1
1
1
1
1
1
1
1
1
1
1
1
1
1
1
1
1
1
1
1
1
1
1
1
1
1
1
1
1
1
1
1
1
1
1
1
1
1
1
1
1
1
1
1
1
1
1
1
1
1
1
1
1
1
1
1
1
1
1
1
1
1
1
1
1
1
1
1
1
1
1
1
1
1
1
1
1
1
1
1
1
1
1
1
1
1
1
1
1
1
1
1
1
1
1
1
1
1
1
1
1
1
1
1
1
1
1
1
1
1
1
1
1
1
1
1
1
1
1
1
1
1
1
1
1
1
1
1
1
1
1
1
1
1
1
1
1
1
1
1
1
1
1
1
1
1
1
1
1
1
1
1
1
1
1
1
1
1
1
1
1
1
1
1
1
1
1
1
1
1
1
1
1
1
1
1
1
1
1
1
1
1
1
1
1
1
1
1
1
1
1
1
1
1
1
1
1
1
1
1
1
1
1
1
1
1
1
1
1
1
1
1
1
1
1
1
1
1
1
1
1
1
1
1
1
1
1
1
1
1
1
1
1
1
1
1
1
1
1
1
1
1
1
1
1
1
1
1
1
1
1
1
1
1
1
1
1
1
1
1
1
1
1
1
1
1
1
1
1
1
1
1
1
1
1
1
1
1
1
1
1
1
1
1
1
1
1
1
1
1
1
1
1
1
1
1
1
1
1
1
1
1
1
1
1
1
1
1
1
1
1
1
1
1
1
1
1
1
1
1
1
1
1
1
1
1
1
1
1
1
1
1
1
1
1
1
1
1
1
1
1
1
1
1
1
1
1
1
1
1
1
1
1
1
1
1
1
1
1
1
1
1
1
1
1
1
1
1
1
1
1
1
1
1
1
1
1
1
1
1
1
1
1
1
1
1
1
1
1
1
1
1
1
1
1
1
1
1
1
1
1
1
1
1
1
1
1
1
1
1
1
1
1
1
1
1
1
1
1
1
1
1
1
1
1
1
1
1
1
1
1
1
1
1
1
1
1
1
1
1
1
1
1
1
1
1
1
1
1
1
1
1
1
1
1
1
1
1
1
1
1
1
1
1
1
1
1
1
1
1
1
1
1
1
1
1
1
1
1
1
1
1
1
1
1
1
1
1
1
1
1
1
1
1
1
1
1
1
1
1
1
1
1
1
1
1
1
1
1
1
1
1
1
1
1
1
1
1
1
1
1
1
1
1
1
1
1
1
1
1
1
1
1
1
1
1
1
1
1
1
1
1
1
1
1
1
1
1
1
1
1
1
1
1
1
1
1
1
1
1
1
1
1
1
1
1
1
1
1
1
1
1
1
1
1
1
1
1
1
1
1
1
1
1
1
1
1
1
1
1
1
1
1
1
1
1
1
1
1
1
1
1
1
1
1
1
1
1
1
1
1
1
1
1
1
1
1
1
1
1
1
1
1
1
1
1
1
1
1
1
1
1
1
1
1
1
1
1
1
1
1
1
1
1
1
1
1
1
1
1
1
1
1
1
1
1
1
1
1
1
1
1
1
1
1
1
1
1
1
1
1
1
1
1
1
1
1
1
1
1
1
1
1
1
1
1
1
1
1
1
1
1
1
1
1
1
1
1
1
1
1
1
1
1
1
1
1
1
1
1
1
1
1
1
1
1
1
1
1
1
1
1
1
1
1
1
1
1
1
1
1
1
1
1
1
1
1
1
1
1
1
1
1
1
1
1
1
1
1
1
1
1
1
1
1
1
1
1
1
1
1
1
1
1
1
1
1
1
1
1
1
1
1
1
1
1
1
1
1
1
1
1
1
1
1
1
1
1
1
1
1
1
1
1
1
1
1
1
1
1
1
1
1
1
1
1
1
1
1
1
1
1
1
1
1
1
1
1
1
1
1
1
1
1
1
1
1
1
1
1
1
1
1
1
1
1
1
1
1
1
1
1
1
1
1
1
1
1
1
1
1
1
1
1
1
1
1
1
1
1
1
1
1
1
1
1
1
1
1
1
1
1
1
1
1
1
1
1
1
1
1
1
1
1
1
1
1
1
1
1
1
1
1
1
1
1
1
1
1
1
1
1
1
1
1
1
1
1
1
1
1
1
1
1
1
1
1
1
1
1
1
1
1
1
1
1
1
1
1
1
1
1
1
1
1
1
1
1
1
1
1
1
1
1
1
1
1
1
1
1
1
1
1
1
1
1
1
1
1
1
1
1
1
1
1
1
1
1
1
1
1
1
1
1
1
1
1
1
1
1
1
1
1
1
1
1
1
1
1
1
1
1
1
1
1
1
1
1
1
1
1
1
1
1
1
1
1
1
1
1
1
1
1
1
1
1
1
1
1
1
1
1
1
1
1
1
1
1
1
1
1
1
1
1
1
1
1
1
1
1
1
1
1
1
1
1
1
1
1
1
1
1
1
1
1
1
1
1
1
1
1
1
1
1
1
1
1
1
1
1
1
1
1
1
1
1
1
1
1
1
1
1
1
1
1
1
1
1
1
1
1
1
1
1
1
1
1
1
1
1
1
1
1
1
1
1
1
1
1
1
1
1
1
1
1
1
1
1
1
1
1
1
1
1
1
1
1
1
1
1
1
1
1
1
1
1
1
1
1
1
1
1
1
1
1
1
1
1
1
1
1
1
1
1
1
1
1
1
1
1
1
1
1
1
1
1
1
1
1
1
1
1
1
1
1
1
1
1
1
1
1
1
1
1
1
1
1
1
1
1
1
1
1
1
1
1
1
1
1
1
1
1
1
1
1
1
1
1
1
1
1
1
1
1
1
1
1
1
1
1
1
1
1
1
1
1
1
1
1
1
1
1
1
1
1
1
1
1
1
1
1
1
1
1
1
1
1
1
1
1
1
1
1
1
1
1
1
1
1
1
1
1
1
1
1
1
1
1
1
1
1
1
1
1
1
1
1
1
1
1
1
1
1
1
1
1
1
1
1
1
1
1
1
1
1
1
1
1
1
1
1
1
1
1
1
1
1
1
1
1
1
1
1
1
1
1
1
1
1
1
1
1
1
1
1
1
1
1
1
1
1
1
1
1
1
1
1
1
1
1
1
1
1
1
1
1
1
1
1
1
1
1
1
1
1
1
1
1
1
1
1
1
1
1
1
1
1
1
1
1
1
1
1
1
1
1
1
1
1
1
1
1
1
1
1
1
1
1
1
1
1
1
1
1
1
1
1
1
1
1
1
1
1
1
1
1
1
1
1
1
1
1
1
1
1
1
1
1
1
1
1
1
1
1
1
1
1
1
1
1
1
1
1
1
1
1
1
1
1
1
1
1
1
1
1
1
1
1
1
1
1
1
1
1
1
1
1
1
1
1
1
1
1
1
1
1
1
1
1
1
1
1
1
1
1
1
1
1
1
1
1
1
1
1
1
1
1
1
1
1
1
1
1
1
1
1
1
1
1
1
1
1
1
1
1
1
1
1
1
1
1
1
1
1
1
1
1
1
1
1
1
1
1
1
1
1
1
1
1
1
1
1
1
1
1
1
1
1
1
1
1
1
1
1
1
1
1
1
1
1
1
1
1
1
1
1
1
1
1
1
1
1
1
1
1
1
1
1
1
1
1
1
1
1
1
1
1
1
1
1
1
1
1
1
1
1
1
1
1
1
1
1
1
1
1
1
1
1
1
1
1
1
1
1
1
1
1
1
1
1
1
1
1
1
1
1
1
1
1
1
1
1
1
1
1
1
1
1
1
1
1
1
1
1
1
1
1
1
1
1
1
1
1
1
1
1
1
1
1
1
1
1
1
1
1
1
1
1
1
1
1
1
1
1
1
1
1
1
1
1
1
1
1
1
1
1
1
1
1
1
1
1
1
1
1
1
1
1
1
1
1
1
1
1
1
1
1
1
1
1
1
1
1
1
1
1
1
1
1
1
1
1
1
1
1
1
1
1
1
1
1
1
1
1
1
1
1
1
1
1
1
1
1
1
1
1
1
1
1
1
1
1
1
1
1
1
1
1
1
1
1
1
1
1
1
1
1
1
1
1
1
1
1
1
1
1
1
1
1
1
1
1
1
1
1
1
1
1
1
1
1
1
1
1
1
1
1
1
1
1
1
1
1
1
1
1
1
1
1
1
1
1
1
1
1
1
1
1
1
1
1
1
1
1
1
1
1
1
1
1
1
1
1
1
1
1
1
1
1
1
1
1
1
1
1
1
1
1
1
1
1
1
1
1
1
1
1
1
1
1
1
1
1
1
1
1
1
1
1
1
1
1
1
1
1
1
1
1
1
1
1
1
1
1
1
1
1
1
1
1
1
1
1
1
1
1
1
1
1
1
1
1
1
1
1
1
1
1
1
1
1
1
1
1
1
1
1
1
1
1
1
1
1
1
1
1
1
1
1
1
1
1
1
1
1
1
1
1
1
1
1
1
1
1
1
1
1
1
1
1
1
1
1
1
1
1
1
1
1
1
1
1
1
1
1
1
1
1
1
1
1
1
1
1
1
1
1
1
1
1
1
1
1
1
1
1
1
1
1
1
1
1
1
1
1
1
1
1
1
1
1
1
1
1
1
1
1
1
1
1
1
1
1
1
1
1
1
1
1
1
1
1
1
1
1
1
1
1
1
1
1
1
1
1
1
1
1
1
1
1
1
1
1
1
1
1
1
1
1
1
1
1
1
1
1
1
1
1
1
1
1
1
1
1
1
1
1
1
1
1
1
1
1
1
1
1
1
1
1
1
1
1
1
1
1
1
1
1
1
1
1
1
1
1
1
1
1
1
1
1
1
1
1
1
1
1
1
1
1
1
1
1
1
1
1
1
1
1
1
1
1
1
1
1
1
1
1
1
1
1
1
1
1
1
1
1
1
1
1
1
1
1
1
1
1
1
1
1
1
1
1
1
1
1
1
1
1
1
1
1
1
1
1
1
1
1
1
1
1
1
1
1
1
1
1
1
1
1
1
1
1
1
1
1
1
1
1
1
1
1
1
1
1
1
1
1
1
1
1
1
1
1
1
1
1
1
1
1
1
1
1
1
1
1
1
1
1
1
1
1
1
1
1
1
1
1
1
1
1
1
1
1
1
1
1
1
1
1
1
1
1
1
1
1
1
1
1
1
1
1
1
1
1
1
1
1
1
1
1
1
1
1
1
1
1
1
1
1
1
1
1
1
1
1
1
1
1
1
1
1
1
1
1
1
1
1
1
1
1
1
1
1
1
1
1
1
1
1
1
1
1
1
1
1
1
1
1
1
1
1
1
1
1
1
1
1
1
1
1
1
1
1
1
1
1
1
1
1
1
1
1
1
1
1
1
1
1
1
1
1
1
1
1
1
1
1
1
1
1
1
1
1
1
1
1
1
1
1
1
Publication Years
1269
2747
388
6
1
Category
1890
246
233
213
132
65
13
2
Toolboxes
364
353
273
267
192
160
156
153
107
101
97
90
75
69
67
64
58
43
29
20
19
18
14
8
7
3
2

Rabies is a global public health problem with important socioeconomic impacts. Human rabies is preventable; almost all cases are transmitted through the bite of a rabid dog. Elimination of human rabies is possible. Technical support and tools are available. This report covers:
- Why investment ... is needed: key rationale.
- Investment purpose: global elimination of rabies.
- Investment in action: four case examples in Philippines, Kwa-Zulu Natal, South Africa, United Republic of Tanzania, Bangladesh.
- Summary results of case examples: Programme similarities and differences, and Health impact success stories from case examples. more
The mandate of the National Tuberculosis Control Programme is to provide leadership and stewardship to accelerate intense and coordinated efforts to reduce the adult TB burden of 290 per 100,000 population recently established in the 2013 National TB Prevalence Survey. Other key challenges are low T
...
B case notification, unacceptably high TB death rates, low antiretroviral therapy (ART) coverage among TB/HIV patients and low drug-resistant notification and treatment.
more
This external performance evaluation of the Malawi Girls’ Empowerment through Education and Health Activity (ASPIRE), conducted 2.5 years after ASPIRE began, establishes the activity’s progress against its objectives, proposes adaptations for the final year, and captures lessons for application
...
in future girls’ empowerment, health, and education programming in Malawi.
more
Non-Wood Forest Products 11
Traditional medicine and its use of medicinal plants is dependent on reliable supply of plant materials. The book focuses on the interface between medicinal plant use and conservation of medicinal plants.

An action research conducted in Bang Shau village Northern Shan State, Myanmar

Medicinal plants occupied an important position in the socio-cultural, spiritual and medicinal arena of rural people of India. T
The present report is based on contribution made by members of the task force and many other experts on medicinal plants. We hope the report on implementation will promot
...
e sustainable and equitable development of medicinal plants sector provide "Health for All", boost exports, and will improve livelihood of the people and green the country for the present and the
generation to come.
more
Final Evaluation
The project objectives were to promote the conservation, sustainable use and cultivation of endangered medicinal plants in Zimbabwe, by demonstrating effective models at the local level, and developing a legal framework for the conservation, sustainable use, and equitable shari ... ng of benefits from medicinal plants at the national level. After one year of implementation, the project rationale, indicators and targets were reviewed in order to make them more rigorous as per the new GEF focus on project impact. New indicators and targets were developed in December 2004. The project is composed of five closely linked output areas that have been allocated to different implementing partners to take a lead in. These include the National Herbarium and Botanical Gardens (Output 1), the University of Zimbabwe School of Pharmacy (Output 2), the Southern Alliance for Indigenous Resources (SAFIRE), a regional NGO (Output 2 and 4), and the Attorney General‟s Office (Output 5). more
The project objectives were to promote the conservation, sustainable use and cultivation of endangered medicinal plants in Zimbabwe, by demonstrating effective models at the local level, and developing a legal framework for the conservation, sustainable use, and equitable shari ... ng of benefits from medicinal plants at the national level. After one year of implementation, the project rationale, indicators and targets were reviewed in order to make them more rigorous as per the new GEF focus on project impact. New indicators and targets were developed in December 2004. The project is composed of five closely linked output areas that have been allocated to different implementing partners to take a lead in. These include the National Herbarium and Botanical Gardens (Output 1), the University of Zimbabwe School of Pharmacy (Output 2), the Southern Alliance for Indigenous Resources (SAFIRE), a regional NGO (Output 2 and 4), and the Attorney General‟s Office (Output 5). more

Infectious disease outbreaks are frequently characterized by scientific uncertainty, social and institutional disruption, and an overall climate of fear and distrust. Policy makers and public health professionals may be forced to weigh and prioritize potentially competing ethical values in the face
...
of severe time and resource constraints. This document seeks to assist policy-makers, health care providers, researchers, and others prepare for outbreak situations by anticipating and preparing for the critical ethical issues likely to arise.
more
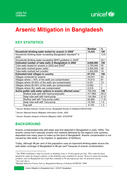
Arsenic contaminated tube well water was first detected in Bangladesh in early 1990s. The arsenic comes from naturally arsenic-rich material delivered by the region's river systems, deposited over many years to make up the land of Bangladesh. Arsenic contamination is not caused by tube wells, or by
...
irrigation or application of fertilizers.
Today, although 98 per cent of the population uses an improved drinking water source the safe water coverage of Bangladesh is 86 per cent because of arsenic contamination. more
Today, although 98 per cent of the population uses an improved drinking water source the safe water coverage of Bangladesh is 86 per cent because of arsenic contamination. more
Guidelines for drinking-water quality: Fourth edition incorporating the first and second addenda
recommended
Guidance has been updated on a number of chemicals: asbestos, bentazone, chromium, iodine, manganese, microcystins, nickel, silver, tetrachloroethene and trichloroethene. Guidance has also been added for chemicals not previously assessed in the Guidelines: anatoxin-a and analogues, cylindrospermopsi
...
ns and saxitoxins. The new guidance on organotins has replaced the prior guidance focused on dialkyltins. With these updates, the guideline values for tetrachloroethene and trichloroethene have been revised while new guideline values for cylindrospermopsins, manganese, microcystins, and saxitoxins have been established .
Updated information on cyanobacteria has been included, introducing an alert level framework for early-warning and to guide short-term management responses. Guidance has also been updated in the sections on adequacy of water supply, climate change, emergencies, food production and processing, and radiological aspects, particularly on managing radionuclides when exceeding WHO screening values and guidance levels.
more
A companion to the Child Friendly Schools Manual
WASH in Schools aims to improve the health and learning performance of school-aged children – and, by extension, that of their families – by reducing the incidence of water and sanitation-related diseases. Every child friendly school r ... equires appropriate WASH initiatives that keep the school environment clean and free of smells and inhibit the transmission of harmful bacteria, viruses and parasites. more
WASH in Schools aims to improve the health and learning performance of school-aged children – and, by extension, that of their families – by reducing the incidence of water and sanitation-related diseases. Every child friendly school r ... equires appropriate WASH initiatives that keep the school environment clean and free of smells and inhibit the transmission of harmful bacteria, viruses and parasites. more
This field guide is a practical tool for improving and maintaining drinking-water safety. It is designed to be used by YOU as a rural community member who shares responsibility for operation and management of the drinking-water supply in your community. It can also be used by YOU as a staff member o
...
f the local health or water supply office, local government authority, nongovernmental organization (NGO) or other community-based organization that supports drinking-water safety in rural communities. Ensuring the safety of the community water supply is a daily job, and community members and other stakeholders have to work jointly to achieve this goal.
more
more
A two-week mission was conducted by WASH and quality UHC technical experts from WHO headquarters and supported by the WHO Ethiopia Country Office (WASH and health systems teams) in July 2016, to understand how change in WASH services and quality improvements have been implemented in Ethiopia at nati
...
onal, sub-national and facility levels; to document existing activities; and through the “joint lens” of quality UHC and WASH, to identify and seek to address key bottlenecks in specific areas including leadership, policy/financing, monitoring and evaluation, evidence application and facility improvements. Ethiopia has implemented a number of innovative and successful interventions.
more
Census Report Volume 4-C
The 2014 Myanmar Census provided the opportunity to measure maternal mortality. The questions on deaths in households during the twelve months prior to the Census were included in the questionnaire, as well as questions necessary to estimate maternal mortality indicator ... s. more
The 2014 Myanmar Census provided the opportunity to measure maternal mortality. The questions on deaths in households during the twelve months prior to the Census were included in the questionnaire, as well as questions necessary to estimate maternal mortality indicator ... s. more
Census Report Volume 4-B
In the 2014 Census, early-age mortality was measured from the responses to two simple retrospective questions on childbearing addressed to ever-married women aged 15 and over. These questions referred to how many live children they had ever given birth to, and how many ... had died (or survived). Adult mortality was measured by using a question on the number of household members who had died during the 12 months preceding the Census.
According to the 2014 Census, infant and child mortality, which comprises under-five mortality, was high compared to other countries in the region. Previous estimates indicated a rapid decline during the 1960s and 1970s, with a substantial deceleration starting in the early 1980s. The decline has accelerated again during recent years. more
Census Report Volume 4-K
The results of the 2014 Census collected only relates to four of the six types of disability domains recommended by the Washington Group on Disability Statistics, namely: seeing, hearing, walking, and remembering or concentrating.
Out of a total of 50.3 million pe ... rsons enumerated in the 2014 Census, there were 2.3 million persons (4.6 per cent of the total population) who reported some degree of difficulty with either one or more of the four functional domains. Of this number, over half a million (representing over 1 per cent of the population as a whole) reported having a lot of difficulty or could not do one or more of the four activities at all (referred to as severe disability). Among those with the severest degree of disability, 55 thousand were blind, 43 thousand were deaf, 99 thousand could not walk at all and 90 thousand did not have the capability to remember or concentrate.
The Census shows that disability is predominantly an old age phenomenon with its prevalence remaining low up to a certain age, after which rates increase substantially. more
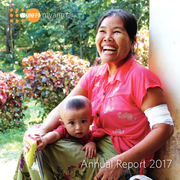
Ensuring reproductive rights for all