Filter
2028
Text search:
key
child
nutrition
indicators
Featured
161
742
Language
1995
30
23
21
17
12
9
3
2
2
2
2
2
1
1
1
1
1
1
1
1
1
1
1
1
1
1
1
1
Document type
1337
294
145
108
85
25
17
11
4
2
Countries / Regions
123
111
88
79
77
70
62
61
59
55
52
49
48
47
47
41
40
28
27
26
25
25
24
21
19
17
16
15
14
14
14
14
12
11
11
10
9
9
9
8
8
8
8
7
7
6
6
5
5
5
5
4
4
4
4
4
3
3
3
3
3
3
2
2
2
2
2
2
2
2
2
2
2
2
2
2
1
1
1
1
1
1
1
1
1
1
1
1
1
1
1
1
1
1
1
1
Authors & Publishers
157
76
63
56
51
45
38
30
29
24
22
21
17
16
16
13
12
10
10
10
9
9
9
9
9
9
8
8
8
8
8
8
7
7
7
7
7
7
6
6
6
6
6
6
6
6
6
6
6
6
6
6
6
5
5
5
5
5
5
5
5
5
5
5
5
5
5
5
5
5
5
5
5
5
4
4
4
4
4
4
4
4
4
4
4
4
4
4
4
4
4
4
4
4
4
4
4
4
4
4
4
4
4
4
4
4
4
4
4
4
4
3
3
3
3
3
3
3
3
3
3
3
3
3
3
3
3
3
3
3
3
3
3
3
3
3
3
3
3
3
3
3
3
3
3
3
3
3
3
3
3
3
3
3
2
2
2
2
2
2
2
2
2
2
2
2
2
2
2
2
2
2
2
2
2
2
2
2
2
2
2
2
2
2
2
2
2
2
2
2
2
2
2
2
2
2
2
2
2
2
2
2
2
2
2
2
2
2
2
2
2
2
2
2
2
2
2
2
2
2
2
2
2
2
2
2
2
2
2
2
2
2
2
2
2
2
2
2
2
2
2
2
2
2
2
2
2
2
2
2
2
2
2
2
2
2
2
2
2
2
2
2
2
2
2
2
2
2
2
2
2
2
2
2
2
2
2
2
2
2
2
2
2
2
2
2
2
2
2
2
2
2
2
2
2
2
2
2
2
2
2
2
1
1
1
1
1
1
1
1
1
1
1
1
1
1
1
1
1
1
1
1
1
1
1
1
1
1
1
1
1
1
1
1
1
1
1
1
1
1
1
1
1
1
1
1
1
1
1
1
1
1
1
1
1
1
1
1
1
1
1
1
1
1
1
1
1
1
1
1
1
1
1
1
1
1
1
1
1
1
1
1
1
1
1
1
1
1
1
1
1
1
1
1
1
1
1
1
1
1
1
1
1
1
1
1
1
1
1
1
1
1
1
1
1
1
1
1
1
1
1
1
1
1
1
1
1
1
1
1
1
1
1
1
1
1
1
1
1
1
1
1
1
1
1
1
1
1
1
1
1
1
1
1
1
1
1
1
1
1
1
1
1
1
1
1
1
1
1
1
1
1
1
1
1
1
1
1
1
1
1
1
1
1
1
1
1
1
1
1
1
1
1
1
1
1
1
1
1
1
1
1
1
1
1
1
1
1
1
1
1
1
1
1
1
1
1
1
1
1
1
1
1
1
1
1
1
1
1
1
1
1
1
1
1
1
1
1
1
1
1
1
1
1
1
1
1
1
1
1
1
1
1
1
1
1
1
1
1
1
1
1
1
1
1
1
1
1
1
1
1
1
1
1
1
1
1
1
1
1
1
1
1
1
1
1
1
1
1
1
1
1
1
1
1
1
1
1
1
1
1
1
1
1
1
1
1
1
1
1
1
1
1
1
1
1
1
1
1
1
1
1
1
1
1
1
1
1
1
1
1
1
1
1
1
1
1
1
1
1
1
1
1
1
1
1
1
1
1
1
1
1
1
1
1
1
1
1
1
1
1
1
1
1
1
1
1
1
1
1
1
1
1
1
1
1
1
1
1
1
1
1
1
1
1
1
1
1
1
1
1
1
1
1
1
1
1
1
1
1
1
1
1
1
1
1
1
1
1
1
1
1
1
1
1
1
1
1
1
1
1
1
1
1
1
1
1
1
1
1
1
1
1
1
1
1
1
1
1
1
1
1
1
1
1
1
1
1
1
1
1
1
1
1
1
1
1
1
1
1
1
1
1
1
1
1
1
1
1
1
1
1
1
1
1
1
1
1
1
1
1
1
1
1
1
1
1
1
1
1
1
1
1
1
1
1
1
1
1
1
1
1
1
1
1
1
1
1
1
1
1
1
1
1
1
1
1
1
1
1
1
1
1
1
1
1
1
1
1
1
1
1
1
1
1
1
1
1
1
1
1
1
1
1
1
1
1
1
1
1
1
1
1
1
1
1
1
1
1
1
1
1
1
1
1
1
1
1
1
1
1
1
1
1
1
1
1
1
1
1
1
1
1
1
1
1
1
1
1
1
1
1
1
1
1
1
1
1
1
1
1
1
1
1
1
1
1
1
1
1
1
1
1
1
1
1
1
1
1
1
1
1
1
1
1
1
1
1
1
1
1
1
1
1
1
1
1
1
1
1
1
1
1
1
1
1
1
1
1
1
1
1
1
1
1
1
1
1
1
1
1
1
1
1
1
1
1
1
1
1
1
1
1
1
1
1
1
1
1
1
1
1
1
1
1
1
1
1
1
1
1
1
1
1
1
1
1
1
1
1
1
1
1
1
1
1
1
1
1
1
1
1
1
1
1
1
1
1
1
1
1
1
1
1
1
1
1
1
1
1
1
1
1
1
1
1
1
1
1
1
1
1
1
1
1
1
1
1
1
1
1
1
1
1
1
1
1
1
1
1
1
1
1
1
1
1
1
1
1
1
1
1
1
1
1
1
1
1
1
1
1
1
1
1
1
1
1
1
1
1
1
1
1
1
1
1
1
1
1
1
1
1
1
1
1
1
1
1
1
1
1
1
1
1
1
1
1
1
1
1
1
1
1
1
1
1
1
1
1
1
1
1
1
1
1
1
1
1
1
1
1
1
1
1
1
1
1
1
1
1
1
1
1
1
1
1
1
1
1
1
1
1
1
1
1
1
1
1
1
1
1
1
1
1
1
1
1
1
1
1
1
1
1
1
1
1
1
1
1
1
1
1
1
1
1
1
1
1
1
1
1
1
1
1
1
1
1
1
1
1
1
1
1
1
1
1
1
1
1
1
1
1
1
1
1
1
1
1
1
1
1
1
1
1
1
1
1
1
1
1
1
1
1
1
1
1
1
1
1
1
1
1
1
1
1
1
1
1
1
1
1
1
1
1
1
1
1
1
1
1
1
1
1
1
1
1
1
1
1
1
1
1
1
1
1
1
1
1
1
1
1
1
1
1
1
1
1
1
1
1
1
1
1
1
1
1
1
1
1
1
1
1
1
1
1
1
1
1
1
1
1
1
1
1
1
1
1
1
1
1
1
1
1
1
1
1
1
1
1
1
1
1
1
1
1
1
1
1
1
1
1
1
1
1
1
1
1
1
1
1
1
1
1
1
1
1
1
1
1
1
1
1
1
1
1
1
1
1
1
1
1
1
1
1
1
1
1
1
1
1
1
1
1
1
1
1
1
1
1
1
1
1
1
1
1
1
1
1
1
1
1
1
1
1
1
1
1
1
1
1
1
1
1
1
1
1
1
1
1
1
1
1
1
1
1
1
1
1
1
1
1
1
1
1
1
1
1
1
1
1
1
1
1
1
1
1
1
1
1
1
1
1
1
1
1
1
1
1
1
1
1
1
1
1
1
1
1
1
1
1
1
1
1
1
1
1
1
1
1
1
1
1
1
1
1
1
1
1
1
1
1
1
1
1
1
1
1
1
1
1
1
1
1
1
1
1
1
1
1
1
1
1
1
1
1
1
1
1
1
1
1
1
1
1
1
1
1
1
1
1
1
1
1
1
1
1
1
1
1
1
1
1
1
1
1
1
1
1
1
1
1
1
1
1
1
1
1
1
1
1
1
1
1
1
1
1
1
1
1
1
1
1
1
1
1
1
1
1
1
1
1
1
1
1
1
1
1
1
1
1
1
1
1
1
1
1
1
1
1
1
1
1
1
1
1
1
1
1
1
1
1
1
1
1
1
1
1
1
1
1
1
1
1
1
1
1
1
1
1
1
1
1
1
1
1
1
1
1
1
1
1
1
1
1
1
1
1
1
1
1
1
Publication Years
443
1394
185
5
1
Category
1175
163
140
101
82
32
2
Toolboxes
84
83
78
77
74
69
58
58
56
26
23
23
22
20
18
14
8
7
7
6
6
3
3
2
2
1
Further Analysis of the 2000, 2005, and 2011 Demographic and Health Surveys. DHS Further Analysis Reports No. 79

Data from the 2000, 2005, and 2011 Demographic and Health Surveys. DHS Trend Reports No. 7

Humanitarian crises exacerbate nutritional risks and often lead to an increase in acute malnutrition. Emergencies include both manmade (conflict) and natural disasters (floods, drought, cyclones, typhoons, earthquakes, volcanic eruptions, etc.). Complex emergencies are combinations of both manmade a
...
nd natural disasters, often of a protracted nature. Millions of people are affected by humanitarian crises every year. The increasing frequency and scale of emergencies requires nutrition to be addressed in all phases of a response.
Crisis situations, whether acute or protracted, impact on a range of factors that can increase the risk of undernutrition, morbidity, and mortality. They may involve: the large-scale destruction of property and infrastructure; the erosion of livelihood strategies and purchasing power; a breakdown of and reduced access to essential services, including health services, water supply, and sanitation; and the displacement of large numbers of people. Emergencies can also disrupt social systems and the quality of care/feeding practices. Household access to food may be negatively affected and people may find themselves in overcrowded settlements with their families divided. As a result, at the individual level, there is often an increased risk of deteriorating health and nutritional status, resulting in a greater likelihood of death.
more


DHS Further Analysis Reports No. 97
Levels and Inequities
DHS Further Analysis Reports No. 110
This study shows large variations in maternal health indicators across high-priority counties in Kenya. Nairobi exceeds the national average on all maternal health ... indicators in this study, while other highpriority counties consistently are disadvantaged compared with Kenya as a whole in most maternal health indicators. Kisumu exceeds the national average in use of antenatal care, delivery in a health facility, and postnatal care, but not other indicators. Nakuru has fewer women with fertility risk and fewer women who report that the distance they must travel to reach a health facility is a problem.
This study identifies a number of inequities in maternal health indicators across socio-demographic characteristics in the high-priority counties—most in the distribution of delivery care and least in antenatal care. Inequities are also observed in fertility risk and postnatal care. more

The Minimum Standards and Indicators for Community Engagement were developed through an inter‑agency consultation process that engaged a large number of experts from around the world. UNICEF wishes to acknowledge the contribution of all those that
...
participated, and who share a passion for placing communities at the centre of development and humanitarian action. The consultation process consisted of a series of interviews, meetings and workshops over an 18‑month period. Representatives from countries in Africa, Asia, the Middle East, Europe and North America contributed input and feedback based on their experiences of designing, implementing and measuring community engagement approaches
more
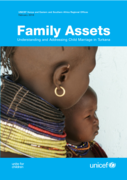
Child marriage is a widespread practice across Turkana, a nomadic pastoralist region in Kenya. This report explores the issue through the voices of those girls affected by it.

This report is the annual global monitoring report documenting progress towards Sustainable Development Goal (SDG) 2 targets 2.1 and 2.2. This year’s report explores the links between urbanization and changing food systems and how these changes are impacting the availability, affordability and des
...
irability of healthy diets, food security and malnutrition in all its forms. It shows that understanding the ways in which urbanization is shaping food systems will require using a rural-urban continuum lens. By mapping the interlinkages across the rural-urban continuum, governments can identify challenges created by urbanization and suitable policies, technologies, investments and governance mechanisms to help address them.
more
The Core Set of Indicators and respective Indicator Data Sheets aim to pave the way towards a common understanding, greater consistency and comparability across countries and alignment of results chains of German Development Cooperation in the field
...
of health and social health protection with the internationally recognized health systems framework of WHO and International Health Partnership (IHP+).
more