Filter
4328
Text search:
publications
Featured
489
877
Language
3767
568
153
125
64
44
43
16
10
8
7
7
6
6
6
6
6
6
5
5
5
5
5
5
4
4
4
4
3
3
3
3
3
2
2
2
2
1
1
1
1
1
1
1
1
1
1
1
1
1
1
1
1
Document type
1889
863
779
376
173
109
64
28
20
10
6
6
2
Countries
270
129
94
69
60
55
45
44
44
44
44
38
37
37
36
36
36
32
32
31
30
27
27
26
25
23
20
19
19
19
19
18
17
17
15
15
14
14
14
13
13
12
12
11
11
10
10
10
10
9
8
8
8
8
8
8
7
7
7
7
6
6
6
6
5
5
5
5
5
5
5
4
4
4
4
4
4
4
4
4
3
3
3
3
3
3
3
3
2
2
2
2
2
2
2
2
2
2
2
2
2
2
2
2
2
2
2
2
2
2
1
1
1
1
1
1
1
1
1
1
1
1
1
1
1
1
1
1
1
1
1
1
1
1
Authors & Publishers
1067
299
204
197
110
107
95
88
74
64
48
45
41
33
26
25
24
24
23
23
23
22
20
18
16
15
14
14
13
13
13
13
11
11
10
10
10
9
9
9
9
8
8
8
8
8
8
8
8
7
7
7
7
7
7
6
6
6
6
6
6
6
6
6
6
6
6
5
5
5
5
5
5
5
5
5
5
5
5
5
5
5
5
5
5
5
5
5
5
4
4
4
4
4
4
4
4
4
4
4
4
4
4
4
4
4
4
4
4
4
4
4
4
4
4
4
4
4
4
4
3
3
3
3
3
3
3
3
3
3
3
3
3
3
3
3
3
3
3
3
3
3
3
3
3
3
3
3
3
3
3
3
3
3
3
3
3
3
3
3
3
3
3
3
3
3
3
3
3
3
3
3
3
3
3
3
3
3
3
3
3
3
3
3
3
3
3
3
3
3
3
2
2
2
2
2
2
2
2
2
2
2
2
2
2
2
2
2
2
2
2
2
2
2
2
2
2
2
2
2
2
2
2
2
2
2
2
2
2
2
2
2
2
2
2
2
2
2
2
2
2
2
2
2
2
2
2
2
2
2
2
2
2
2
2
2
2
2
2
2
2
2
2
2
2
2
2
2
2
2
2
2
2
2
2
2
2
2
2
2
2
2
2
2
2
2
2
2
2
2
2
2
2
2
2
2
2
2
2
2
2
2
2
2
2
2
2
2
2
2
2
2
2
2
2
2
2
2
2
2
2
2
2
2
2
2
2
2
2
2
2
2
2
2
2
2
2
2
2
2
2
2
2
2
2
2
2
2
2
2
2
2
2
2
2
2
2
2
2
2
2
2
2
2
2
2
2
2
2
2
2
2
2
2
2
2
2
2
2
2
2
2
2
2
2
2
1
1
1
1
1
1
1
1
1
1
1
1
1
1
1
1
1
1
1
1
1
1
1
1
1
1
1
1
1
1
1
1
1
1
1
1
1
1
1
1
1
1
1
1
1
1
1
1
1
1
1
1
1
1
1
1
1
1
1
1
1
1
1
1
1
1
1
1
1
1
1
1
1
1
1
1
1
1
1
1
1
1
1
1
1
1
1
1
1
1
1
1
1
1
1
1
1
1
1
1
1
1
1
1
1
1
1
1
1
1
1
1
1
1
1
1
1
1
1
1
1
1
1
1
1
1
1
1
1
1
1
1
1
1
1
1
1
1
1
1
1
1
1
1
1
1
1
1
1
1
1
1
1
1
1
1
1
1
1
1
1
1
1
1
1
1
1
1
1
1
1
1
1
1
1
1
1
1
1
1
1
1
1
1
1
1
1
1
1
1
1
1
1
1
1
1
1
1
1
1
1
1
1
1
1
1
1
1
1
1
1
1
1
1
1
1
1
1
1
1
1
1
1
1
1
1
1
1
1
1
1
1
1
1
1
1
1
1
1
1
1
1
1
1
1
1
1
1
1
1
1
1
1
1
1
1
1
1
1
1
1
1
1
1
1
1
1
1
1
1
1
1
1
1
1
1
1
1
1
1
1
1
1
1
1
1
1
1
1
1
1
1
1
1
1
1
1
1
1
1
1
1
1
1
1
1
1
1
1
1
1
1
1
1
1
1
1
1
1
1
1
1
1
1
1
1
1
1
1
1
1
1
1
1
1
1
1
1
1
1
1
1
1
1
1
1
1
1
1
1
1
1
1
1
1
1
1
1
1
1
1
1
1
1
1
1
1
1
1
1
1
1
1
1
1
1
1
1
1
1
1
1
1
1
1
1
1
1
1
1
1
1
1
1
1
1
1
1
1
1
1
1
1
1
1
1
1
1
1
1
1
1
1
1
1
1
1
1
1
1
1
1
1
1
1
1
1
1
1
1
1
1
1
1
1
1
1
1
1
1
1
1
1
1
1
1
1
1
1
1
1
1
1
1
1
1
1
1
1
1
1
1
1
1
1
1
1
1
1
1
1
1
1
1
1
1
1
1
1
1
1
1
1
1
1
1
1
1
1
1
1
1
1
1
1
1
1
1
1
1
1
1
1
1
1
1
1
1
1
1
1
1
1
1
1
1
1
1
1
1
1
1
1
1
1
1
1
1
1
1
1
1
1
1
1
1
1
1
1
1
1
1
1
1
1
1
1
1
1
1
1
1
1
1
1
1
1
1
1
1
1
1
1
1
1
1
1
1
1
1
1
1
1
1
1
1
1
1
1
1
1
1
1
1
1
1
1
1
1
1
1
1
1
1
1
1
1
1
1
1
1
1
1
1
1
1
1
1
1
1
1
1
1
1
1
1
1
1
1
1
1
1
1
1
1
1
1
1
1
1
1
1
1
1
1
1
1
1
1
1
1
1
1
1
1
1
1
1
1
1
1
1
1
1
1
1
1
1
1
1
1
1
1
1
1
1
1
1
1
1
1
1
1
1
1
1
1
1
1
1
1
1
1
1
1
1
1
1
1
1
1
1
1
1
1
1
1
1
1
1
1
1
1
1
1
1
1
1
1
1
1
1
1
1
1
1
1
1
1
1
1
1
1
1
1
1
1
1
1
1
1
1
1
1
1
1
1
1
1
1
1
1
1
1
1
1
1
1
1
1
1
1
1
1
1
1
1
1
1
1
1
1
1
1
1
1
1
1
1
1
1
1
1
1
1
1
1
1
1
1
1
1
1
1
1
1
1
1
1
1
1
1
1
1
1
1
1
1
1
1
1
1
1
1
1
1
1
1
1
1
1
1
1
1
1
1
1
1
1
1
1
1
1
1
1
1
1
1
1
1
1
1
1
1
1
1
1
1
1
1
1
1
1
1
1
1
1
1
1
1
1
1
1
1
1
1
1
1
1
1
1
1
1
1
1
1
1
1
1
1
1
1
1
1
1
1
1
1
1
1
1
1
1
1
1
1
1
1
1
1
1
1
1
1
1
1
1
1
1
1
1
1
1
1
1
1
1
1
1
1
1
1
1
1
1
1
1
1
1
1
1
1
1
1
1
1
1
1
1
1
1
1
1
1
1
1
1
1
1
1
1
1
1
1
1
1
1
1
1
1
1
1
1
1
1
1
1
1
1
1
1
1
1
1
1
1
1
1
1
1
1
1
1
1
1
1
1
1
1
1
1
1
1
1
1
1
1
1
1
1
1
1
1
1
1
1
1
1
1
1
1
1
1
1
1
1
1
1
1
1
1
1
1
1
1
1
1
1
1
1
1
1
1
1
1
1
1
1
1
1
1
1
1
1
1
1
1
1
1
1
1
1
1
1
1
1
1
1
1
1
1
1
1
1
1
1
1
1
1
1
1
1
1
1
1
1
1
1
1
1
1
1
1
1
1
1
1
1
1
1
1
1
1
1
1
1
1
1
1
1
1
1
1
1
1
1
1
1
1
1
1
1
1
1
1
1
1
1
1
1
1
1
1
1
1
1
1
1
1
1
1
1
1
1
1
1
1
1
1
1
1
1
1
1
1
1
1
1
1
1
1
1
1
1
1
1
1
1
1
1
1
1
1
1
1
1
1
1
1
1
1
1
1
1
1
1
1
1
1
1
1
1
1
1
1
1
1
1
1
1
1
1
1
1
1
1
1
1
1
1
1
1
1
1
1
1
1
1
1
1
1
1
1
1
1
1
1
1
1
1
1
1
1
1
1
1
1
1
1
1
1
1
1
1
1
1
1
1
1
1
1
1
1
1
1
1
1
1
1
1
1
1
1
1
1
1
1
1
1
1
1
1
1
1
1
1
1
1
1
1
1
1
1
1
1
1
1
1
1
1
1
1
1
1
1
1
1
1
1
1
1
1
1
1
1
1
1
1
1
1
1
1
1
1
1
1
1
1
1
1
1
1
1
1
1
1
1
1
1
1
1
1
1
1
1
1
1
1
1
1
1
1
1
1
1
1
1
1
1
1
1
1
1
1
1
1
1
1
1
1
1
1
1
1
1
1
1
1
1
1
1
1
1
1
1
1
1
1
1
1
1
1
1
1
1
1
1
1
1
1
1
1
1
1
1
1
1
1
1
1
1
1
1
1
1
1
1
1
1
1
1
1
1
1
1
1
1
1
1
1
1
1
1
1
1
1
1
1
1
1
1
1
1
1
1
1
1
1
1
1
1
1
1
1
1
1
1
1
1
1
1
1
1
1
1
1
1
1
1
1
1
1
1
1
1
1
1
1
1
1
1
1
1
1
1
1
1
1
1
1
1
1
1
1
1
1
1
1
1
1
1
1
1
1
1
1
1
1
1
1
1
1
1
1
1
1
1
1
1
1
1
1
1
1
1
1
1
1
1
1
1
1
1
1
1
1
1
1
1
1
1
1
1
1
1
1
1
1
1
1
1
1
1
1
1
1
1
1
1
1
1
1
1
1
1
1
1
1
1
1
1
1
1
1
1
1
1
1
1
1
1
1
1
1
1
1
1
1
1
1
1
1
1
1
1
1
1
1
1
1
1
1
1
1
1
1
1
1
1
1
1
1
1
1
1
1
1
1
1
1
1
1
1
1
1
1
1
1
1
1
1
1
1
1
1
1
1
1
1
1
1
1
1
1
1
1
1
1
1
1
1
1
1
1
1
1
1
1
1
1
1
1
1
1
1
1
1
1
1
1
1
1
1
1
1
1
1
1
1
1
1
1
1
1
1
1
1
1
1
1
1
1
1
1
1
1
1
1
1
1
1
1
1
1
1
1
1
1
1
1
1
1
1
1
1
1
1
1
1
1
1
1
1
1
1
1
1
1
1
1
1
1
1
1
1
1
1
1
1
1
1
1
1
1
1
1
1
1
1
1
1
1
1
1
1
1
1
1
1
1
1
1
1
1
1
1
1
1
1
1
1
1
1
1
1
1
1
1
1
1
1
1
1
1
1
1
1
1
1
1
1
1
1
1
1
1
1
1
1
1
1
1
1
1
1
1
1
1
1
1
1
1
1
1
1
1
1
1
1
1
1
1
1
1
1
1
1
1
1
1
1
1
1
1
1
1
1
1
1
1
1
1
1
1
1
1
1
1
1
1
1
1
1
1
1
1
1
1
1
1
1
1
1
1
1
1
1
1
1
1
1
1
1
1
1
1
1
1
1
1
1
1
1
1
1
1
1
1
1
1
1
1
1
1
1
1
1
1
1
1
1
1
1
1
1
1
1
1
1
1
1
1
1
1
1
1
1
1
1
1
1
1
1
1
1
1
1
1
1
1
1
1
1
1
1
1
1
1
1
1
1
1
1
1
1
1
1
1
1
1
1
1
1
1
1
1
1
1
1
1
1
1
1
1
1
1
1
1
1
1
1
1
1
1
1
1
1
1
1
1
1
1
1
1
1
1
1
1
1
1
1
1
1
1
1
1
1
1
1
1
1
1
1
1
1
1
1
1
1
1
1
1
1
1
1
1
1
1
1
1
1
1
1
1
1
1
1
1
1
1
1
1
1
1
1
1
1
1
1
1
1
1
1
1
1
1
1
1
1
1
1
1
1
1
1
1
1
1
1
1
1
1
1
1
1
1
1
1
1
1
1
1
1
1
1
1
1
1
1
1
1
1
1
1
1
1
1
1
1
1
1
1
1
1
1
1
1
1
1
1
1
1
1
1
1
1
1
1
1
1
1
1
1
1
1
1
1
1
1
1
1
1
1
1
1
1
1
1
1
1
1
1
1
1
1
1
1
1
1
1
1
1
1
1
1
1
1
1
1
1
1
1
1
1
1
1
1
1
1
1
1
1
1
1
1
1
1
1
1
1
1
1
1
1
1
1
1
1
1
1
1
1
1
1
1
1
1
1
1
1
1
1
1
1
1
1
1
1
1
1
1
1
1
1
1
1
1
1
1
1
1
1
1
1
1
1
1
1
1
1
1
1
1
1
1
1
1
1
1
1
1
1
1
1
1
1
1
1
1
1
1
1
1
1
1
1
1
1
1
1
1
1
1
1
1
1
1
1
1
1
1
1
1
1
1
1
1
1
1
1
1
1
1
1
1
1
1
1
1
1
1
1
1
1
1
1
1
1
1
1
1
1
1
1
1
1
1
1
1
1
1
1
1
1
1
1
1
1
1
1
1
1
1
1
1
1
1
1
1
1
1
1
1
1
1
1
1
1
Publication Years
1
1540
2400
358
28
1
Category
819
519
371
366
351
106
99
3
Toolboxes
514
300
268
221
208
197
187
153
128
126
112
105
100
98
89
89
86
76
58
47
44
34
27
24
18
3
This document has been developed to provide training and guidance on how to integrate a human rights approach in mental health and related areas, based on international human rights instruments, in particular the UN Convention on the Rights of Persons with Disabilities (CRPD).
This document has been developed to provide training and guidance to be able to understand what are human rights, what human rights mean for people’s lives, as well as the actions that can be taken by individuals and groups to respect and promote human rights.
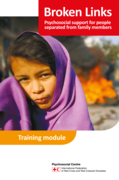
Broken Links: Psychosocial support for people separated from family members (Training
module) and the corresponding Broken Links field guide are designed to support staff and
volunteers in a wide range of settings where they may be in contact with families who have
been separated from their loved
...
ones. The field guide and the training module outline the
causes and consequences of being separated from family members, as well as the types of
contact staff and volunteers might have with families affected by separation.
more
GMS Zeitschrift für MedizinischeAusbildung 2015, Vol. 32(5),ISSN 1860-3572
Internationalizing higher education is considered to be a major goal for universities in Germany and many medical students aspire to include international experiences into their academic training. However, the exact meani
...
ng of “internationalizing” medical education is still poorly defined, just as is the possible pedagogic impact and effects. Against this background, this article presents the special track curriculum on global health (in German: Schwerpunktcurriculum Global Health, short: SPC) at Justus Liebig University Giessen, which was established in 2011 as a comprehensive teaching program to integrate international perspectives and activities systematically into the clinical years of the medical curriculum
more
This guide was developed by AACAP to give reliable information about medication
used to treat bipolar disorder in children and adolescents to parents whose children
have been diagnosed with the illness.
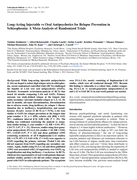
Schizophr Bull. 2014 Jan;40(1):192-213. doi: 10.1093/schbul/sbs150. Epub 2012 Dec 17.
IK Notes No. 10 July 1999 | IK Notes reports periodically on Indigenous Knowledge (IK) initiatives in Sub-Saharan Africa. It is published by the Africa Region's Knowledge and Learning Center as part of an evolving IK partnership between the World Bank, communities, NGOs, development institutions and
...
multilateral organizations. T
more

Music therapy can help traumatized children and adults to stabilize and to create a safe space for the expression of feelings and thoughts. In a 1 day international symposium on Friday May 26, presenting lectures and workshops, we’ll highlight the way music therapy research, methods and technique
...
s are applied to treating childhood trauma and sexual abuse, traumatized refugees, prisoners and victims of violence.
more
Child protection psychosocial training manual
recommended
The Terre des hommes Child Protection Psychosocial Training Manual has been developed for use in the field
in order to train animators who work with children and other child protection programme staff. It has
been written in response to the needs which exist in Terre des hommes child protection pr
...
ogrammes,
and should be used as a practical tool alongside the Child Protection: Manual for Intervention in Humanitarian
Crisis, previously produced by Terre des hommes.
The modules in this manual have been grouped according to the following categories:
• Level 1: Facilitating a training
• Level 2: Basic concepts for intervention
• Level 3: Animator’s competencies
Each module is laid out under the following headings:
• What is it?
• Why is it useful?
• How can I use it?
more
This Review summarizes many of the persistent biological alterations associated with childhood maltreatment including changes in neuroendocrine and neurotransmitter systems and pro-inflammatory cytokines in addition to specific alterations in brain areas associated with mood regulation. Finally, I d
...
iscuss several candidate gene polymorphisms that interact with childhood maltreatment to modulate vulnerability to major depression and PTSD and epigenetic mechanisms thought to transduce environmental stressors into disease vulnerability.
Neuron Review, vol. 89, March 2, 2016 pp.892-909
more
This manual outlines proposals for the insertion of housing, land and property restitution rights simultaneously within the context of the ongoing peace process and within broader national legal reform efforts, including work towards a national land law. The paper begins by emphasising that many cou
...
ntries emerging from both conflict and political reform processes have successfully implemented restitution programmes, and that the current, largely piecemeal, efforts towards restitution in Myanmar under the Central Land Grab Reinvestigation Committee processes are simply inadequate in securing restitution rights for everyone in and from Myanmar with a legitimate restitution claim.
more
Social Determinants of Health Discussion Paper 1 (Debates). This paper was prepared for the launch of the Commission on Social Determinants of Health (CSDH) by its secretariat based at WHO in Geneva. It was discussed by the Commissioners and then revised considering their input.
Guide for community-based management and care of people with dementia
Version 1.0
Mental Health and Substance Abuse
Division of NCD and Health through the Life-Course
World Health Organization Regional Office for the Western Pacific
Home-based therapeutic exercise as a treatment for Parkinson's Disease: an integrative review
Ihana Thaís Guerra de Oliveira Gondim; Carla Cabral dos Santos Accioly Lins; Maria das Graças Wanderley de Sales Coriolano
Revista Brasileira de Geriatria e Gerontologia; SCIELO
(2016)
C2
Print version ISSN 1809-9823On-line version ISSN 1981-2256
Rev. bras. geriatr. gerontol. vol.19 no.2 Rio de Janeiro Mar./Apr. 2016
http://dx.doi.org/10.1590/1809-98232016019.150040
Methamphetamine continues to dominate synthetic drug markets
United Nations Office on Drugs and Crime; Global smart
(2018)
C2
Volume 20, September
Global smart update


Drugs, Alcohol and HIV/AIDS
Substance Abuse and Mental Health Services Administration
(2015)
C2
A Consumer Guide
Printed 2006
Revised 2007, 2008, 2011, 2014, and 2015
Rapid review and case studies from Member States
La promotion du bon usage et l’utilisation appropriée des antimicrobiens sont à la base du quatrième objectif du Plan d’action mondial pour combattre la résistance aux antimicrobiens de l’Organisation mondiale de la Santé (OMS), adopté par les États Membres lors de la Soixante-Huitième
...
Assemblée mondiale de la Santé en 2015. En vue de soutenir la mise en œuvre de programmes pour le bon usage des antimicrobiens dans le secteur de la santé humaine au sein des pays à revenu faible et intermédiaire, l’OMS a publié une boîte à outils pratique en 2019
more
This paper presents a bibliometric analysis of the literature on private health aid and official health assistance between 2000 and 2022. It provides an overview of the sites and themes in the literature pertaining to development assistance in health, and collates the significant policy recommendati
...
ons presented therein. Several crucial findings emerge from the bibliometric analysis: 44.2 percent of the 489 papers/articles assessed focused on lower-middle-income countries, while 37.7 percent focused on low-income countries. However, authors affiliated with institutes and organisations from lower-middle- and low-income countries contributed merely 15.5 percent and 11.8 percent, respectively, of the papers assessed. Most (72.7 percent) were written by authors from highmiddle-
and high-income countries. Additionally, despite non-governmental
organisations, philanthropies, and private businesses constituting about 20 percent of development assistance donors, a mere 4 percent of all papers focused on these entities.
more