Filter
294
Text search:
estimaciones
Featured
22
51
Language
Document type
115
75
57
21
15
4
3
2
1
1
Countries
41
23
18
18
13
11
9
8
8
8
7
4
4
3
3
2
2
2
2
1
1
1
1
1
1
1
Authors & Publishers
Publication Years
Category
120
24
21
14
7
Toolboxes
42
42
41
17
13
8
8
8
4
4
3
2
2
2
1
1
1
1
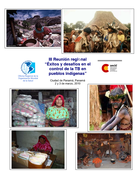
Ciudad de Panamá, Panamá 2 y 3 de marzo, 2010
En la actualidad, las guías basadas en la evidencia constituyen una de las herramientas más útiles para mejorar la salud pública y la práctica clínica. Su finalidad es formular intervenciones con sólidas pruebas de eficacia, evitar riesgos innecesarios, utilizar los recursos de forma eficient
...

"La finalidad del presente MANUAL DE LA OMS PARA LA GESTIÓN DE SALUD PÚBLICA DE LOS INCIDENTES QUÍMICOS es proporcionar una panorámica general de los principios y funciones de la salud pública en materia de gestión de incidentes y emergencias químicos. Aunque se brinda información para cada
...
La Estrategia, una vez aplicada, contribuirá a que disminuyan radicalmente las ITS y las muertes relacionadas con dichas infecciones (incluidas las muertes fetales intrauterinas y el cáncer cervicouterino), al tiempo que mejorará la salud individual, la salud sexual de los hombres y las mujeres,
...

INT J TUBERC LUNG DIS 22(2):197–205 http://dx.doi.org/10.5588/ijtld.17.0245

Encuesta Nacional de Condiciones de Vida 2015 (ENCOVI)
Encuesta Nacional de Condiciones de Vida 2016 (ENCOVI 2016)
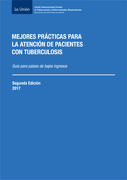
Guía para países de bajos ingresos. 2 edición
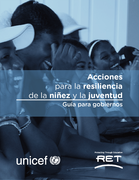
Propósito de la guía. Considerando el contexto de aumento de factores de riesgo de origen natural y social al cual está sujeta la población en general y los niños, niñas, adolescentes y jóvenes (NNAJ) en forma particular, el propósito de esta guía es ofrecer orientaciones a los gobiernos pa
...
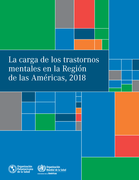
El documento La carga de los trastornos mentales en la Región de las Américas, 2018 tiene como propósito mejorar la evaluación de las necesidades en materia de salud mental en la Región de las Américas al presentar un panorama actualizado y matizado de: a) la discapacidad debida a los trastorn
...
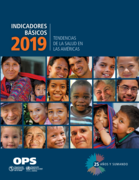
El informe Indicadores básicos 2019: tendencias de la salud en las Américas comienza con un panorama demográfico de la Región que muestra los cambios que han ocurrido a lo largo de los últimos 25 años. Estos indicadores demográficos proporcionan un contexto útil para comprender mejor las car
...
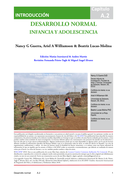
Introducción
Capítulo A.2
Edición: Matías Irarrázaval & Andres Martin
Revisión: Fernanda Prieto-Tagle & Miguel Ángel Álvarez