Filter
1372
Text search:
marriage
Featured
99
484
Language
Document type
936
232
72
40
38
23
16
6
4
2
1
1
Countries
93
54
53
52
45
43
43
43
39
39
37
35
31
28
23
22
21
19
16
16
16
15
14
14
13
13
11
11
11
10
10
10
9
9
8
7
7
6
6
6
6
6
5
5
5
5
4
4
4
4
3
3
3
3
3
3
3
3
3
3
3
2
2
2
2
2
2
2
2
2
1
1
1
1
1
1
1
1
1
1
1
1
1
1
1
Authors & Publishers
Publication Years
Category
737
152
45
41
39
22
Toolboxes
128
96
83
78
76
42
28
20
19
19
17
14
12
11
5
2
2
1
1
1
Census Report Volume 4-A
This thematic report presents findings on fertility and nuptiality in Myanmar. The analysis hows that the total fertility rate is 2.5 children per woman at the Union level, 1.9 children per woman for urban areas, and 2.8 children per woman for rural areas. Total fertili ...
This thematic report presents findings on fertility and nuptiality in Myanmar. The analysis hows that the total fertility rate is 2.5 children per woman at the Union level, 1.9 children per woman for urban areas, and 2.8 children per woman for rural areas. Total fertili ...


Data from the 2000, 2005, and 2011 Ethiopia Demographic and Health Surveys | This report examines trends in key demographic indicators among youth from the findings of the 2000, 2005, and 2011 Ethiopia Demographic and Health Surveys (EDHS).
Further Analysis of the 2000, 2005, and 2011 Demographic and Health Surveys. DHS Further Analysis Reports No. 80

Further Analysis of the 2000, 2005, and 2011 Demographic Health Surveys. DHS Further Analysis Reports No. 72

Data from the 2000, 2005, and 2011 Demographic and Health Surveys. DHS Trend Reports No. 7

DHS Working Papers No. 90.


DHS Further Analysis Reports No. 101

Analysis developed by Track20 based on WPP2017 population estimates for 2018 and 2014-15 DHS, unless otherwise noted

Accessed on 28.02.2020
Quickstats Senegal
Информация о том, как COVID-19 влияет на ЛГБТИ
COVID-19 and the rigths of LGBTI

Amoris laetitia: Post-Synodal Apostolic Exhortation on love in the family (19 March 2016)
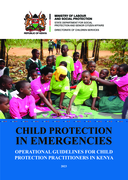
These guidelines provide a clear framework for child-centred emergency preparedness, response and recovery. They are intended for use by state and non-state actors directly involved in interventions, as well as other stakeholders whose work may contribute to the overall safety and well-being of chil
...
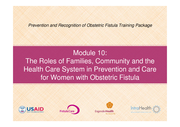
Module 10: The Roles of Families, Community and the Health Care System in Prevention and Care for Women with Obstetric Fistula