Filter
5854
Text search:
good
practice
Featured
588
1537
Language
5683
142
114
86
84
37
36
36
12
11
9
9
8
8
7
7
6
6
6
5
5
5
4
4
4
4
4
4
4
3
3
3
3
3
3
3
3
3
3
3
3
3
2
2
2
2
2
2
2
2
2
2
2
2
2
1
1
1
1
1
1
1
1
Document type
3157
876
853
442
204
170
81
20
18
14
10
7
1
Countries
283
251
172
140
132
126
121
118
117
97
95
94
85
79
79
78
68
65
62
62
54
50
46
44
42
37
35
34
31
31
31
30
29
29
25
25
25
24
22
22
21
17
17
16
16
15
14
14
13
12
11
11
11
11
11
10
9
9
9
8
7
7
7
7
7
7
7
7
6
6
5
5
5
5
5
4
4
4
4
4
4
4
4
4
3
3
3
3
3
3
3
3
3
3
3
3
2
2
2
2
2
2
2
2
2
2
2
2
2
2
2
1
1
1
1
1
1
1
1
1
1
1
1
1
1
1
1
1
1
1
1
1
1
1
1
1
1
1
1
Authors & Publishers
770
246
175
144
132
130
129
95
62
45
42
38
38
35
31
29
28
28
25
25
23
22
22
21
20
20
19
19
19
19
19
17
17
16
15
15
15
15
15
15
14
14
14
13
13
13
13
13
12
12
12
12
12
12
11
11
11
11
11
11
11
11
11
11
10
10
10
10
10
10
10
10
9
9
9
9
9
9
9
9
9
9
8
8
8
8
8
8
8
8
8
8
8
8
8
8
8
8
8
8
8
7
7
7
7
7
7
7
7
7
7
7
7
7
7
7
7
7
7
6
6
6
6
6
6
6
6
6
6
6
6
6
6
6
6
6
6
6
6
6
6
6
6
6
6
6
6
5
5
5
5
5
5
5
5
5
5
5
5
5
5
5
5
5
5
5
5
5
5
5
5
5
5
5
5
5
5
5
5
5
4
4
4
4
4
4
4
4
4
4
4
4
4
4
4
4
4
4
4
4
4
4
4
4
4
4
4
4
4
4
4
4
4
4
4
4
4
4
4
4
4
4
4
4
4
4
4
4
4
4
4
4
4
4
4
4
4
3
3
3
3
3
3
3
3
3
3
3
3
3
3
3
3
3
3
3
3
3
3
3
3
3
3
3
3
3
3
3
3
3
3
3
3
3
3
3
3
3
3
3
3
3
3
3
3
3
3
3
3
3
3
3
3
3
3
3
3
3
3
3
3
3
3
3
3
3
3
3
3
3
3
3
3
3
3
3
3
3
3
3
3
3
3
3
3
3
3
3
3
3
3
3
3
3
3
3
3
3
3
3
3
3
3
3
3
3
3
3
3
3
3
2
2
2
2
2
2
2
2
2
2
2
2
2
2
2
2
2
2
2
2
2
2
2
2
2
2
2
2
2
2
2
2
2
2
2
2
2
2
2
2
2
2
2
2
2
2
2
2
2
2
2
2
2
2
2
2
2
2
2
2
2
2
2
2
2
2
2
2
2
2
2
2
2
2
2
2
2
2
2
2
2
2
2
2
2
2
2
2
2
2
2
2
2
2
2
2
2
2
2
2
2
2
2
2
2
2
2
2
2
2
2
2
2
2
2
2
2
2
2
2
2
2
2
2
2
2
2
2
2
2
2
2
2
2
2
2
2
2
2
2
2
2
2
2
2
2
2
2
2
2
2
2
2
2
2
2
2
2
2
2
2
2
2
2
2
2
2
2
2
2
2
2
2
2
2
2
2
2
2
2
2
2
2
2
2
2
2
2
2
2
2
2
2
2
2
2
2
2
2
2
2
2
2
2
2
2
2
2
2
2
2
2
2
2
2
2
2
2
2
2
2
2
2
2
2
2
2
2
2
2
2
2
2
2
2
2
2
2
2
2
2
2
2
2
2
2
2
2
2
2
2
2
2
2
2
2
2
2
2
2
2
2
2
2
2
2
2
2
2
2
2
2
2
2
2
2
2
2
2
2
2
2
2
2
2
2
2
2
2
2
2
2
2
2
2
2
2
2
2
2
2
2
2
2
2
2
2
2
2
2
2
2
2
2
2
1
1
1
1
1
1
1
1
1
1
1
1
1
1
1
1
1
1
1
1
1
1
1
1
1
1
1
1
1
1
1
1
1
1
1
1
1
1
1
1
1
1
1
1
1
1
1
1
1
1
1
1
1
1
1
1
1
1
1
1
1
1
1
1
1
1
1
1
1
1
1
1
1
1
1
1
1
1
1
1
1
1
1
1
1
1
1
1
1
1
1
1
1
1
1
1
1
1
1
1
1
1
1
1
1
1
1
1
1
1
1
1
1
1
1
1
1
1
1
1
1
1
1
1
1
1
1
1
1
1
1
1
1
1
1
1
1
1
1
1
1
1
1
1
1
1
1
1
1
1
1
1
1
1
1
1
1
1
1
1
1
1
1
1
1
1
1
1
1
1
1
1
1
1
1
1
1
1
1
1
1
1
1
1
1
1
1
1
1
1
1
1
1
1
1
1
1
1
1
1
1
1
1
1
1
1
1
1
1
1
1
1
1
1
1
1
1
1
1
1
1
1
1
1
1
1
1
1
1
1
1
1
1
1
1
1
1
1
1
1
1
1
1
1
1
1
1
1
1
1
1
1
1
1
1
1
1
1
1
1
1
1
1
1
1
1
1
1
1
1
1
1
1
1
1
1
1
1
1
1
1
1
1
1
1
1
1
1
1
1
1
1
1
1
1
1
1
1
1
1
1
1
1
1
1
1
1
1
1
1
1
1
1
1
1
1
1
1
1
1
1
1
1
1
1
1
1
1
1
1
1
1
1
1
1
1
1
1
1
1
1
1
1
1
1
1
1
1
1
1
1
1
1
1
1
1
1
1
1
1
1
1
1
1
1
1
1
1
1
1
1
1
1
1
1
1
1
1
1
1
1
1
1
1
1
1
1
1
1
1
1
1
1
1
1
1
1
1
1
1
1
1
1
1
1
1
1
1
1
1
1
1
1
1
1
1
1
1
1
1
1
1
1
1
1
1
1
1
1
1
1
1
1
1
1
1
1
1
1
1
1
1
1
1
1
1
1
1
1
1
1
1
1
1
1
1
1
1
1
1
1
1
1
1
1
1
1
1
1
1
1
1
1
1
1
1
1
1
1
1
1
1
1
1
1
1
1
1
1
1
1
1
1
1
1
1
1
1
1
1
1
1
1
1
1
1
1
1
1
1
1
1
1
1
1
1
1
1
1
1
1
1
1
1
1
1
1
1
1
1
1
1
1
1
1
1
1
1
1
1
1
1
1
1
1
1
1
1
1
1
1
1
1
1
1
1
1
1
1
1
1
1
1
1
1
1
1
1
1
1
1
1
1
1
1
1
1
1
1
1
1
1
1
1
1
1
1
1
1
1
1
1
1
1
1
1
1
1
1
1
1
1
1
1
1
1
1
1
1
1
1
1
1
1
1
1
1
1
1
1
1
1
1
1
1
1
1
1
1
1
1
1
1
1
1
1
1
1
1
1
1
1
1
1
1
1
1
1
1
1
1
1
1
1
1
1
1
1
1
1
1
1
1
1
1
1
1
1
1
1
1
1
1
1
1
1
1
1
1
1
1
1
1
1
1
1
1
1
1
1
1
1
1
1
1
1
1
1
1
1
1
1
1
1
1
1
1
1
1
1
1
1
1
1
1
1
1
1
1
1
1
1
1
1
1
1
1
1
1
1
1
1
1
1
1
1
1
1
1
1
1
1
1
1
1
1
1
1
1
1
1
1
1
1
1
1
1
1
1
1
1
1
1
1
1
1
1
1
1
1
1
1
1
1
1
1
1
1
1
1
1
1
1
1
1
1
1
1
1
1
1
1
1
1
1
1
1
1
1
1
1
1
1
1
1
1
1
1
1
1
1
1
1
1
1
1
1
1
1
1
1
1
1
1
1
1
1
1
1
1
1
1
1
1
1
1
1
1
1
1
1
1
1
1
1
1
1
1
1
1
1
1
1
1
1
1
1
1
1
1
1
1
1
1
1
1
1
1
1
1
1
1
1
1
1
1
1
1
1
1
1
1
1
1
1
1
1
1
1
1
1
1
1
1
1
1
1
1
1
1
1
1
1
1
1
1
1
1
1
1
1
1
1
1
1
1
1
1
1
1
1
1
1
1
1
1
1
1
1
1
1
1
1
1
1
1
1
1
1
1
1
1
1
1
1
1
1
1
1
1
1
1
1
1
1
1
1
1
1
1
1
1
1
1
1
1
1
1
1
1
1
1
1
1
1
1
1
1
1
1
1
1
1
1
1
1
1
1
1
1
1
1
1
1
1
1
1
1
1
1
1
1
1
1
1
1
1
1
1
1
1
1
1
1
1
1
1
1
1
1
1
1
1
1
1
1
1
1
1
1
1
1
1
1
1
1
1
1
1
1
1
1
1
1
1
1
1
1
1
1
1
1
1
1
1
1
1
1
1
1
1
1
1
1
1
1
1
1
1
1
1
1
1
1
1
1
1
1
1
1
1
1
1
1
1
1
1
1
1
1
1
1
1
1
1
1
1
1
1
1
1
1
1
1
1
1
1
1
1
1
1
1
1
1
1
1
1
1
1
1
1
1
1
1
1
1
1
1
1
1
1
1
1
1
1
1
1
1
1
1
1
1
1
1
1
1
1
1
1
1
1
1
1
1
1
1
1
1
1
1
1
1
1
1
1
1
1
1
1
1
1
1
1
1
1
1
1
1
1
1
1
1
1
1
1
1
1
1
1
1
1
1
1
1
1
1
1
1
1
1
1
1
1
1
1
1
1
1
1
1
1
1
1
1
1
1
1
1
1
1
1
1
1
1
1
1
1
1
1
1
1
1
1
1
1
1
1
1
1
1
1
1
1
1
1
1
1
1
1
1
1
1
1
1
1
1
1
1
1
1
1
1
1
1
1
1
1
1
1
1
1
1
1
1
1
1
1
1
1
1
1
1
1
1
1
1
1
1
1
1
1
1
1
1
1
1
1
1
1
1
1
1
1
1
1
1
1
1
1
1
1
1
1
1
1
1
1
1
1
1
1
1
1
1
1
1
1
1
1
1
1
1
1
1
1
1
1
1
1
1
1
1
1
1
1
1
1
1
1
1
1
1
1
1
1
1
1
1
1
1
1
1
1
1
1
1
1
1
1
1
1
1
1
1
1
1
1
1
1
1
1
1
1
1
1
1
1
1
1
1
1
1
1
1
1
1
1
1
1
1
1
1
1
1
1
1
1
1
1
1
1
1
1
1
1
1
1
1
1
1
1
1
1
1
1
1
1
1
1
1
1
1
1
1
1
1
1
1
1
1
1
1
1
1
1
1
1
1
1
1
1
1
1
1
1
1
1
1
1
1
1
1
1
1
1
1
1
1
1
1
1
1
1
1
1
1
1
1
1
1
1
1
1
1
1
1
1
1
1
1
1
1
1
1
1
1
1
1
1
1
1
1
1
1
1
1
1
1
1
1
1
1
1
1
1
1
1
1
1
1
1
1
1
1
1
1
1
1
1
1
1
1
1
1
1
1
1
1
1
1
1
1
1
1
1
1
1
1
1
1
1
1
1
1
1
1
1
1
1
1
1
1
1
1
1
1
1
1
1
1
1
1
1
1
1
1
1
1
1
1
1
1
1
1
1
1
1
1
1
1
1
1
1
1
1
1
1
1
1
1
1
1
1
1
1
1
1
1
1
1
1
1
1
1
1
1
1
1
1
1
1
1
1
1
1
1
1
1
1
1
1
1
1
1
1
1
1
1
1
1
1
1
1
1
1
1
1
1
1
1
1
1
1
1
1
1
1
1
1
1
1
1
1
1
1
1
1
1
1
1
1
1
1
1
1
1
1
1
1
1
1
1
1
1
1
1
1
1
1
1
1
1
1
1
1
1
1
1
1
1
1
1
1
1
1
1
1
1
1
1
1
1
1
1
1
1
1
1
1
1
1
1
1
1
1
1
1
1
1
1
1
1
1
1
1
1
1
1
1
1
1
1
1
1
1
1
1
1
1
1
1
1
1
1
1
1
1
1
1
1
1
1
1
1
1
1
1
1
1
1
1
1
1
1
1
1
1
1
1
1
1
1
1
1
1
1
1
1
1
1
1
1
1
1
1
1
1
1
1
1
1
1
1
1
1
1
1
1
1
1
1
1
1
1
1
1
1
1
1
1
1
1
1
1
1
1
1
1
1
1
1
1
1
1
1
1
1
1
1
1
1
1
1
1
1
1
1
1
1
1
1
1
1
1
1
1
1
1
1
1
1
1
1
1
1
1
1
1
1
1
1
1
1
1
1
1
1
1
1
1
1
1
1
1
1
1
1
1
1
1
1
1
1
1
1
1
1
1
1
1
1
1
1
1
1
1
1
1
1
1
1
1
1
1
1
1
1
1
1
1
1
1
1
1
1
1
1
1
1
1
1
1
1
1
1
1
1
1
1
1
1
1
1
1
1
1
1
1
1
1
1
1
1
1
1
1
1
1
1
1
1
1
1
1
1
1
1
1
1
1
1
1
1
1
1
1
1
1
1
1
1
1
1
1
1
1
1
1
1
1
1
1
1
1
1
1
1
1
1
1
1
1
1
1
1
1
1
1
1
1
1
1
1
1
1
1
1
1
1
1
1
1
1
1
1
1
1
1
1
1
1
1
1
1
1
1
1
1
1
1
1
1
1
1
1
1
1
1
1
1
1
1
1
1
1
1
1
1
1
1
1
1
1
1
1
1
1
1
1
1
1
1
1
1
1
1
1
1
1
1
1
1
1
1
1
1
1
1
1
1
1
1
1
1
1
1
1
1
1
1
1
1
1
1
1
1
1
1
1
1
1
1
1
1
1
1
1
1
1
1
1
1
1
1
1
1
1
1
1
1
1
1
1
1
1
1
1
1
1
1
1
1
1
1
1
1
1
1
1
1
1
1
1
1
1
1
1
1
1
1
1
1
1
1
1
1
1
1
1
1
1
1
1
1
1
1
1
1
1
1
1
1
1
1
1
1
1
1
1
1
1
1
1
1
1
1
1
1
1
1
1
1
1
1
1
1
1
1
1
1
1
1
1
1
1
1
1
1
1
1
1
1
1
1
1
1
1
1
1
1
1
1
1
1
1
1
1
1
1
1
1
1
1
1
1
1
1
1
1
1
1
1
1
1
1
1
1
1
1
1
1
1
1
1
1
1
1
1
1
1
1
1
1
1
1
1
1
1
1
1
1
1
1
1
1
1
1
1
1
1
1
1
1
1
1
1
1
1
1
1
1
1
1
1
1
1
1
1
1
1
1
1
1
1
1
1
1
1
1
1
1
1
1
1
1
1
1
1
1
1
1
1
1
1
1
1
1
1
1
1
1
1
1
1
1
1
1
1
1
1
1
1
1
1
1
1
1
1
1
1
1
1
1
1
1
1
1
1
1
1
1
1
1
1
1
1
1
1
1
1
1
1
1
1
1
1
1
1
1
1
1
1
1
1
1
1
1
1
1
1
1
1
1
1
1
1
1
1
1
1
1
1
1
1
1
1
1
1
1
1
1
1
1
1
1
1
1
1
1
1
1
1
1
1
1
1
1
1
1
1
1
1
1
1
1
1
1
1
1
1
1
1
1
1
1
1
1
1
1
1
1
1
1
1
1
1
1
1
1
1
1
1
1
1
1
1
1
1
1
1
1
1
1
1
1
1
1
1
1
1
1
1
1
1
1
1
1
1
1
1
1
1
1
1
1
1
1
1
1
1
1
1
1
1
1
1
1
1
1
1
1
1
1
1
1
1
1
1
1
1
1
1
1
1
1
1
1
1
1
1
1
1
1
1
1
1
1
1
1
1
1
1
1
1
1
1
1
1
1
1
1
1
1
1
1
1
1
1
1
1
1
1
1
1
1
1
1
1
1
1
1
1
1
1
1
1
1
1
1
1
1
1
1
1
1
1
1
1
1
1
1
1
1
1
1
1
1
1
1
1
1
1
1
1
1
1
1
1
1
1
1
1
1
1
1
1
1
1
1
1
1
1
1
1
1
1
1
1
1
1
1
1
1
1
1
1
1
1
1
1
1
1
1
1
1
1
1
1
1
1
1
1
1
1
1
1
1
1
1
1
1
1
1
1
1
1
1
1
1
1
1
1
1
1
1
1
1
1
1
1
1
1
1
1
1
1
1
1
1
1
1
1
1
1
1
1
1
1
1
1
1
1
1
1
1
1
1
1
1
1
1
1
1
1
1
1
1
1
1
1
1
1
1
1
1
1
1
1
1
1
1
1
1
1
1
1
1
1
1
1
1
1
1
1
1
1
1
1
1
1
1
1
1
1
1
1
1
1
1
1
1
1
1
1
1
1
1
1
1
1
1
1
1
1
1
1
1
1
1
1
1
1
1
1
1
1
1
1
1
1
1
1
1
1
1
1
1
1
1
1
1
1
1
1
1
1
1
1
1
1
1
1
1
1
1
1
1
1
1
1
1
1
1
1
1
1
1
1
1
1
1
1
1
1
1
1
1
1
1
1
1
1
1
1
1
1
1
1
1
1
1
1
1
1
1
1
1
1
1
1
1
1
1
1
1
1
1
1
1
1
1
1
1
1
1
1
1
1
1
1
1
1
1
1
1
1
1
1
1
1
1
1
1
1
1
1
1
1
1
1
1
1
1
1
1
1
1
1
1
1
1
1
1
1
1
1
1
1
1
1
1
1
1
1
1
1
1
1
1
1
1
1
1
1
1
1
1
1
1
1
1
1
1
1
1
1
1
1
1
1
1
1
1
1
1
1
1
1
1
1
1
1
1
1
1
1
1
1
1
1
1
1
1
1
1
1
1
1
1
1
1
1
1
1
1
1
1
1
1
1
1
1
1
1
1
1
1
1
1
1
1
1
1
1
1
1
1
1
1
1
1
1
1
1
1
1
1
1
1
1
1
1
1
1
1
1
1
1
1
1
1
1
1
1
1
1
1
1
1
1
1
1
1
1
1
1
1
1
1
1
1
1
1
1
1
1
1
1
1
1
1
1
1
1
1
1
1
1
1
1
1
1
1
1
1
1
1
1
1
1
1
1
1
1
1
1
1
1
1
1
1
1
1
1
1
1
1
1
1
1
1
1
1
1
1
1
1
1
1
1
1
1
1
1
1
1
1
1
1
1
1
1
1
1
1
1
1
1
1
1
1
1
1
1
1
1
1
1
1
1
1
1
1
1
1
1
1
1
1
1
1
1
1
1
1
1
1
1
1
1
1
1
1
1
1
1
1
1
1
1
1
1
1
1
1
1
1
1
1
1
1
1
1
1
1
1
1
1
1
1
1
1
1
1
1
1
1
1
1
1
1
1
1
1
1
1
1
1
1
1
1
1
1
1
1
1
1
1
1
1
1
1
1
1
1
1
1
1
1
1
1
1
1
1
1
1
1
1
1
1
1
1
1
1
1
1
1
1
1
1
1
1
1
1
1
1
1
1
1
1
1
1
1
1
1
1
1
1
1
1
1
1
1
1
1
1
1
1
1
1
1
1
1
1
1
1
1
1
1
1
1
1
1
1
1
1
1
1
1
1
1
1
1
1
1
1
1
1
1
1
1
1
1
1
1
1
1
1
1
1
1
1
1
1
1
1
1
1
1
1
1
1
1
1
1
1
1
1
1
1
1
1
1
1
1
1
1
1
1
1
1
1
1
1
1
1
1
1
1
1
1
1
1
1
1
1
1
1
1
1
1
1
1
1
1
1
1
1
1
1
1
1
1
1
1
1
1
1
1
1
1
1
1
1
1
1
1
1
1
1
1
1
1
1
1
1
1
1
1
1
1
1
1
1
1
1
1
1
1
1
1
1
1
1
1
1
1
1
1
1
1
1
1
1
1
1
1
1
1
1
1
1
1
1
1
1
1
1
1
1
1
1
1
1
1
1
1
1
1
1
1
1
1
1
1
1
1
1
1
1
1
1
1
1
1
1
1
1
1
1
1
1
1
1
1
1
1
1
1
1
1
1
1
1
1
1
1
1
1
1
1
1
1
1
1
1
1
1
1
1
1
1
1
1
1
1
1
1
1
1
1
1
1
1
1
1
1
1
1
1
1
1
1
1
1
1
1
1
1
1
1
1
1
1
1
1
1
1
1
1
1
1
1
1
1
1
1
1
1
1
1
1
1
1
1
1
1
1
1
1
1
1
1
1
1
1
1
1
1
1
1
1
1
1
1
1
1
1
1
1
1
1
1
1
1
1
1
1
1
1
1
1
1
1
1
1
1
1
1
1
1
1
1
1
1
1
1
1
1
1
1
1
1
1
1
1
1
1
1
1
1
1
1
1
1
1
1
1
1
1
1
1
1
1
1
1
1
1
1
1
1
1
1
1
1
1
1
1
1
1
1
1
1
1
1
1
1
1
1
1
1
1
1
1
1
1
1
1
1
1
1
1
1
1
1
1
1
1
1
1
1
1
1
1
1
1
1
1
1
1
1
1
1
1
1
1
1
1
1
1
1
1
1
1
1
1
1
1
1
1
1
1
1
1
1
1
1
1
1
1
1
1
1
1
1
1
1
1
1
1
1
1
1
1
1
1
1
1
1
1
1
1
1
1
1
1
1
1
1
1
1
1
1
1
1
1
1
1
1
1
1
1
1
1
1
1
1
1
1
1
1
1
1
1
1
1
1
1
1
1
1
1
1
1
1
1
1
1
1
1
1
1
1
1
1
1
1
1
1
1
1
1
1
1
1
1
1
1
1
1
1
1
1
1
1
1
1
1
1
1
1
1
1
1
1
1
1
1
1
1
1
1
1
1
1
1
1
1
1
1
1
1
1
1
1
1
1
1
1
1
1
1
1
1
1
1
1
1
1
1
1
1
1
1
1
1
1
1
1
1
1
1
1
1
1
1
1
1
1
1
1
1
1
1
1
1
1
1
1
1
1
1
1
1
1
1
1
1
1
1
1
1
1
1
1
1
1
1
1
1
1
1
1
1
1
1
1
1
1
1
1
1
1
1
1
1
1
1
1
1
1
1
1
1
1
1
1
1
1
1
1
1
1
1
1
1
1
1
1
1
1
1
1
1
1
1
1
1
1
1
1
1
1
1
1
1
1
1
1
1
1
1
1
1
1
1
1
1
1
1
1
1
1
1
1
1
1
1
1
1
1
1
1
1
1
1
1
1
1
1
1
1
1
1
1
1
1
1
1
1
1
1
1
1
1
1
1
1
1
1
1
1
1
1
1
1
1
1
1
1
1
1
1
1
1
1
1
1
1
1
1
1
1
1
1
1
1
1
Publication Years
1
1557
3607
656
28
4
1
Category
2051
498
426
403
346
202
66
2
Toolboxes
554
341
316
243
240
232
198
142
140
136
135
133
131
119
111
104
77
70
69
61
61
41
30
25
21
3
1

The purpose of this ‘Facilitator Guidebook’ is to help the Course Coordinator deliver and document consistently high-quality CBDRR training courses.
- Module 1: Understanding the Basics: introduces the participants to the basics of CBDRR implementation of MRCS, general aspects of CBDRR in ... the context of Myanmar.
- Module 2: Implementing the Program: introduces the participants to the 9 CBDRR steps that are followed by MRCS when implementing community- and school-based programs and key points.
- Module 3: Ensuring Sustainability: introduces the participants to two aspects that are often forgotten when it comes to program implementation.
- Module 4: Being a Facilitator:introduces the participants to facilitation skills and some exercises are carried out that willhelp the participants to be a facilitator of the course themselves in the end. more

Overview:
- Part A is an introductory part which will give you background information about CBDRR in Myanmar. It has a small section about the importance of CBDRR in Myanmar, the stakeholders of CBDRR in Myanmar, as well as an overview about the challenges that are faced when implementing CBDRR ... in Myanmar.
- Part B contains the instructions on how to conduct the 9-step process agreed upon and described in detail in the step-by-step methodology document. These nine (9) steps are considered the minimum required activities to be followed by all MRCS community based initiatives regardless of their budget or time frame.
- Part C includes all the implementation steps of CBDRR programs namely step 6 (Action Plan Development), and step 7 (Implementation of Action Plan).
- Part D includes all the steps that finalize a CBDRR program namely step 4 and step 8 (Baseline and Endline Study) as well as step 9 (Handover & Exit Strategy). more

The changes occurring in Myanmar highlight the need to have a robust DRR network that can support the Government as well as the communities in their efforts to build a resilient Myanmar. To this end, the DRR WG devised and facilitated a multi-stakeholder process aiming to develop its Strategic Frame
...
work 2013-2018. This document is the outcome of a series of internal workshops and external consultations, in particular with the relevant departments of the Government of Myanmar. This Strategic Framework will guide the collective efforts of the DRR WG over the next five years.
more
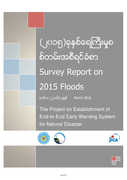
Torrential rains and the onset of Cyclone Komen triggered severe and widespread floods and landslides in July and August 2015 across 12 out of 14 states and regions in Myanmar. An estimated 1.6 million individuals were recorded as having been temporarily displaced from their homes by the disaster, a
...
nd 132 lost their lives. Up to 5.2 million people were exposed to the floods and landslides in the 40 most heavily affected townships. Within the 40 most-affected townships, 775,810 individuals have been displaced, accounting for approximately half of the total displaced population.
The Project recognizes that although the major target disaster is cyclones, the methodology of the Project activities to enhance the capacity of EWS, HRD and CBDRM is also applicable to mitigate the damage of floods. By analyzing the results of a survey based on the experience of the Project activities, the Project can contribute to describe tangible lessons learned and future recommendations for the counterpart agencies and disaster management related agencies of the Government of Myanmar. more
The Project recognizes that although the major target disaster is cyclones, the methodology of the Project activities to enhance the capacity of EWS, HRD and CBDRM is also applicable to mitigate the damage of floods. By analyzing the results of a survey based on the experience of the Project activities, the Project can contribute to describe tangible lessons learned and future recommendations for the counterpart agencies and disaster management related agencies of the Government of Myanmar. more
This is the Technical Annex for the BRACED report: Measuring changes in household resilience as a result of BRACED activities in Myanmar.

Lack of satisfactory progress in mainstreaming disaster risk reduction within development is attributed to various factors. One of the important factor that is often not much appreciated is the inadequate comprehension of mainstreaming and the absence of clear, cogent and practical guidelines, tools
...
and techniques for mainstreaming DRR within development. This Guidebook helps to tackle this challenge by providing strategic and practical guidelines on how to mainstream disaster risk reduction into their policies plans and programmes across key sectors. It discusses strategic approaches towards risk resilient development in the Asia-Pacific region and demonstrates how to operationalize them using examples from various countries in the region. These guidelines can be adopted by countries according to their specific contexts, resources and capacities.
more
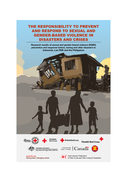
Research results of sexual and gender-based violence (SGBV) prevention and response before, during and after disasters in Indonesia, Lao PDR and the Philippines
This report contributes new evidence on why and how sexual and gender-based violence (SGBV) risks increase during humanitarian disasters ... . It details how humanitarian actors can better prevent and respond to such escalation of SGBV, and better meet the needs of affected women, girls, men and boys. This research is based on community views of disaster-affected women, adolescent girls, men and adolescent boys in three South-East Asian countries: Indonesia, Lao PDR and the Philippines. more
This report contributes new evidence on why and how sexual and gender-based violence (SGBV) risks increase during humanitarian disasters ... . It details how humanitarian actors can better prevent and respond to such escalation of SGBV, and better meet the needs of affected women, girls, men and boys. This research is based on community views of disaster-affected women, adolescent girls, men and adolescent boys in three South-East Asian countries: Indonesia, Lao PDR and the Philippines. more
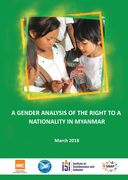
According to 2014 Census data, almost a third of the population in Myanmar do not have adequate identity and civil documentation. Of these, 54 percent are women.
Women who live in remote or conflict affected areas, who are displaced or belong to stateless ethnic and religious minorities face the ... consequences of an insecure legal identity. They cannot enrol their children in school, open a bank account, travel freely or register land.
The report provides an analysis of the gender aspects of citizenship legislation in Myanmar and its application in light of the standards set by the UN Convention on the Elimination of Discrimination Against Women (CEDAW). It analyses in detail women’s ability to acquire citizenship on an equal basis as men, their ability to acquire, retain or confer citizenship following marriage and their ability to confer citizenship to their children. The report highlights the normative and practical challenges faced by women and proposes ways forward. more
The Look Back Study (LBS) focuses on the water and sanitation and hygiene (WASH) component of the project but some additional information was collected along side the WASH data. This data has been compared to the baseline survey data that was reported at start of the project (see tables in annex D t
...
o this report).
more

This assessment is the first of its kind to be conducted in the south-eastern region of Myanmar. It is an important contribution to ensuring the full inclusion of women and children in Myanmar’s political, social, and cultural systems, with a specific focus on the issue of gender-based violence (G
...
BV) and its impact on these groups in south-eastern Myanmar. The United Nations Population Fund (UNFPA) is grateful for the participation of women, men, boys and girls from Mon, Kayin and Kayah States for sharing their views and experiences during the study.
more

The National Health Plan (NHP) aims to strengthen the country’s health system and pave the way towards Universal Health Coverage (UHC),choosing a path that is explicitly pro-poor. The main goal of NHP 2017-2021 is to extend access to a Basic Essential Package of Health Services (EPHS) to the entir
...
e population by 2020 while increasing financial protection.
more


The five hepatitis viruses have different epidemiological profiles, and their impact, duration, and transmission route also vary. The most common transmission routes contributing to the spread of hepatitis are exposure to infected blood via blood transfusion or unsafe injection practices, consumptio
...
n of contaminated food and drinking water, and transmission from mother to child during pregnancy and delivery. Also, unsafe injection practices, including the use of unsterile needles and syringes, serve as a major pathway for the spread of hepatitis B and C, and reducing transmission of both diseases requires addressing these practices.
more

A cross-sectional descriptive study design covering all states and regions was undertaken to:
1) To assess availability, utilization and supply chain management system for RH commodities at different levels of health facilities,
2) To assess quality of RH services with emphasis on family ... planning in terms of training, supervision, use of guidelines and ICT, and
3) To determine clients’ accessibility to RH services provided at different level of facilities. more
March - June 2018
Myanmar introduced Child Death Surveillance and Response (CDSR) in 2015 as an initiative to reduce child (under-5) mortality, an initiative that will contribute to the country’s efforts to meet the Sustainable Development Goals (SDG). Technical Guidelines for CDSR were devel ... oped in 2015 followed by the development of Training Package in 2016. An Implementation Plan was made in 2016; and this led to all townships implementing CDSR in early 2017. After one year of implementation an assessment was carried out in early 2018.
The assessment was conducted in 3 region/states – Ayeyarwaddy, Magway, Shan South, with information gathered from the state/region, district, township and basic health unit levels. In addition a caretaker interview was conducted to see health-seeking behavior. In addition to these three regions/states, information was also gathered from three other regions/states but only at the region/state level – Mandalay, Yangon, Kachin. more

The study analyses the current situation of children with disabilities in relation to realizing their rights and accessing basic services, as well as their life experiences in their communities. It also focuses on identifying the barriers created by society that prevent children with disabilities fr
...
om enjoying their human rights. This includes identifying negative attitudes; environmental and communication barriers; gaps in policies or their effective implementation.
The report reveals that children with disabilities in Myanmar are less likely to access services in health or education; rarely have their voices heard in society; and face daily discrimination as objects of pity. It also highlights how inadequate policies and legislation contribute to the challenges these children face.
The information available in this publication should be useful for policy makers, development partners and Disabled Persons Organisations to promote the realization of the rights of all children with disabilities. more
Version 2, January 2016
The primary purpose of this document is to provide 3MDG stakeholders with some essential information on the MNCH core-indicators for 3MDG, which were derived from the 3MDG Logical Framework, Data Dictionary for Health Service Indicators (2014 June, DoPH, MoH), A ... Guide for Monitoring and Evaluating Child Health Programmes (MEASURE Evaluation, September 2005) and Monitoring Emergency Obstetric Care (WHO/UNICEF/UNFPA/AMDD). Partners are strongly encouraged to integrate the MNCH indicators into their ongoing monitoring and evaluation (M&E) activities.
These indicators are designed to help Partners assess the current state of their activities, their progress towards achieving their targets, and contribution towards the national response. This guideline is designed to improve the quality and consistency of data collected at the township level, which will enhance the accuracy of conclusions drawn when the data are aggregated. more