Filter
1860
Text search:
background
characteristics
Featured
151
539
Language
1830
42
28
21
17
9
9
3
3
2
2
2
2
2
2
1
1
1
1
1
1
1
1
1
1
1
1
1
1
1
1
1
1
1
1
1
1
1
Document type
1112
287
243
121
42
34
10
4
3
2
2
Countries
92
72
71
64
51
41
40
39
39
38
36
34
32
30
30
29
29
28
23
20
17
16
16
14
14
13
11
11
9
9
9
7
7
7
6
6
6
6
5
4
4
4
4
4
4
4
4
4
3
3
3
3
3
3
3
3
3
2
2
2
2
2
2
2
2
2
2
2
2
2
2
2
2
1
1
1
1
1
1
1
1
1
1
1
1
1
1
1
1
1
1
1
1
1
Authors & Publishers
254
84
54
51
42
40
40
36
27
24
17
16
15
15
13
12
12
11
11
10
10
9
9
9
8
7
6
6
6
6
6
6
5
5
5
5
5
5
5
5
5
5
5
5
4
4
4
4
4
4
4
4
4
4
4
4
4
4
4
4
4
4
4
4
4
4
3
3
3
3
3
3
3
3
3
3
3
3
3
3
3
3
3
3
3
3
3
3
3
3
3
3
3
3
3
3
3
3
3
3
3
3
3
3
3
3
3
3
3
3
3
3
3
2
2
2
2
2
2
2
2
2
2
2
2
2
2
2
2
2
2
2
2
2
2
2
2
2
2
2
2
2
2
2
2
2
2
2
2
2
2
2
2
2
2
2
2
2
2
2
2
2
2
2
2
2
2
2
2
2
2
2
2
2
2
2
2
2
2
2
2
2
2
2
2
2
2
2
2
2
2
2
2
2
2
2
2
2
2
2
2
2
2
2
2
2
2
2
2
2
2
2
2
2
2
2
2
2
2
2
2
2
2
2
2
2
2
2
2
1
1
1
1
1
1
1
1
1
1
1
1
1
1
1
1
1
1
1
1
1
1
1
1
1
1
1
1
1
1
1
1
1
1
1
1
1
1
1
1
1
1
1
1
1
1
1
1
1
1
1
1
1
1
1
1
1
1
1
1
1
1
1
1
1
1
1
1
1
1
1
1
1
1
1
1
1
1
1
1
1
1
1
1
1
1
1
1
1
1
1
1
1
1
1
1
1
1
1
1
1
1
1
1
1
1
1
1
1
1
1
1
1
1
1
1
1
1
1
1
1
1
1
1
1
1
1
1
1
1
1
1
1
1
1
1
1
1
1
1
1
1
1
1
1
1
1
1
1
1
1
1
1
1
1
1
1
1
1
1
1
1
1
1
1
1
1
1
1
1
1
1
1
1
1
1
1
1
1
1
1
1
1
1
1
1
1
1
1
1
1
1
1
1
1
1
1
1
1
1
1
1
1
1
1
1
1
1
1
1
1
1
1
1
1
1
1
1
1
1
1
1
1
1
1
1
1
1
1
1
1
1
1
1
1
1
1
1
1
1
1
1
1
1
1
1
1
1
1
1
1
1
1
1
1
1
1
1
1
1
1
1
1
1
1
1
1
1
1
1
1
1
1
1
1
1
1
1
1
1
1
1
1
1
1
1
1
1
1
1
1
1
1
1
1
1
1
1
1
1
1
1
1
1
1
1
1
1
1
1
1
1
1
1
1
1
1
1
1
1
1
1
1
1
1
1
1
1
1
1
1
1
1
1
1
1
1
1
1
1
1
1
1
1
1
1
1
1
1
1
1
1
1
1
1
1
1
1
1
1
1
1
1
1
1
1
1
1
1
1
1
1
1
1
1
1
1
1
1
1
1
1
1
1
1
1
1
1
1
1
1
1
1
1
1
1
1
1
1
1
1
1
1
1
1
1
1
1
1
1
1
1
1
1
1
1
1
1
1
1
1
1
1
1
1
1
1
1
1
1
1
1
1
1
1
1
1
1
1
1
1
1
1
1
1
1
1
1
1
1
1
1
1
1
1
1
1
1
1
1
1
1
1
1
1
1
1
1
1
1
1
1
1
1
1
1
1
1
1
1
1
1
1
1
1
1
1
1
1
1
1
1
1
1
1
1
1
1
1
1
1
1
1
1
1
1
1
1
1
1
1
1
1
1
1
1
1
1
1
1
1
1
1
1
1
1
1
1
1
1
1
1
1
1
1
1
1
1
1
1
1
1
1
1
1
1
1
1
1
1
1
1
1
1
1
1
1
1
1
1
1
1
1
1
1
1
1
1
1
1
1
1
1
1
1
1
1
1
1
1
1
1
1
1
1
1
1
1
1
1
1
1
1
1
1
1
1
1
1
1
1
1
1
1
1
1
1
1
1
1
1
1
1
1
1
1
1
1
1
1
1
1
1
1
1
1
1
1
1
1
1
1
1
1
1
1
1
1
1
1
1
1
1
1
1
1
1
1
1
1
1
1
1
1
1
1
1
1
1
1
1
1
1
1
1
1
1
1
1
1
1
1
1
1
1
1
1
1
1
1
1
1
1
1
1
1
1
1
1
1
1
1
1
1
1
1
1
1
1
1
1
1
1
1
1
1
1
1
1
1
1
1
1
1
1
1
1
1
1
1
1
1
1
1
1
1
1
1
1
1
1
1
1
1
1
1
1
1
1
1
1
1
1
1
1
1
1
1
1
1
1
1
1
1
1
1
1
1
1
1
1
1
1
1
1
1
1
1
1
1
1
1
1
1
1
1
1
1
1
1
1
1
1
1
1
1
1
1
1
1
1
1
1
1
1
1
1
1
1
1
1
1
1
1
1
1
1
1
1
1
1
1
1
1
1
1
1
1
1
1
1
1
1
1
1
1
1
1
1
1
1
1
1
1
1
1
1
1
1
1
1
1
1
1
1
1
1
1
1
1
1
1
1
1
1
1
1
1
1
1
1
1
1
1
1
1
1
1
1
1
1
1
1
1
1
1
1
1
1
1
1
1
1
1
1
1
1
1
1
1
1
1
1
1
1
1
1
1
1
1
1
1
1
1
1
1
1
1
1
1
1
1
1
1
1
1
1
1
1
1
1
1
1
1
1
1
1
1
1
1
1
1
1
1
1
1
1
1
1
1
1
1
1
1
1
1
1
1
1
1
1
1
1
1
1
1
1
1
1
1
1
1
1
1
1
1
1
1
1
1
1
1
1
1
1
1
1
1
1
1
1
1
1
1
1
1
1
1
1
1
1
1
1
1
1
1
1
1
1
1
1
1
1
1
1
1
1
1
1
1
1
1
1
1
1
1
1
1
1
1
1
1
1
1
1
1
1
1
1
1
1
1
1
1
1
1
1
1
1
1
1
1
1
1
1
1
1
1
1
1
1
1
1
1
1
1
1
1
1
1
1
1
1
1
1
1
1
1
1
1
1
1
1
1
1
1
1
1
1
1
1
1
1
1
1
1
1
1
1
1
1
1
1
1
1
1
1
1
1
1
1
1
1
1
1
1
1
1
1
1
1
1
1
1
1
1
1
1
1
1
1
1
1
1
1
1
1
1
1
1
1
1
1
1
1
1
1
1
1
1
1
1
1
1
1
1
1
1
1
1
1
1
1
1
1
1
1
1
1
1
1
1
1
1
1
1
1
1
1
1
1
1
1
1
1
1
1
1
1
1
1
1
1
1
1
1
1
1
1
1
1
1
1
1
1
1
1
1
1
1
1
1
1
1
1
1
1
1
1
1
1
1
1
1
1
1
1
1
1
1
1
1
1
1
1
1
1
1
1
1
1
1
1
1
1
1
1
1
1
1
1
1
1
1
1
1
1
1
1
1
1
1
1
1
1
1
1
1
1
1
1
1
1
1
1
1
1
1
1
1
1
1
1
1
1
1
1
1
1
1
1
1
1
1
1
1
1
1
1
1
1
1
1
1
1
1
1
1
1
1
1
1
1
1
1
1
1
1
1
1
1
1
1
1
1
1
1
1
1
1
1
1
1
1
1
1
1
1
1
1
1
1
1
1
1
1
1
1
1
1
1
1
1
1
1
1
1
1
1
1
1
1
1
1
1
1
1
1
1
1
1
1
1
1
1
1
1
1
1
1
1
1
1
1
1
1
1
1
1
1
1
1
1
1
1
1
1
1
1
1
1
1
1
1
1
1
1
1
1
1
1
1
1
1
1
1
1
1
1
1
1
1
1
1
1
1
1
1
1
1
1
1
1
1
1
1
1
1
1
1
1
1
1
1
1
1
1
1
1
1
1
1
1
1
1
1
1
1
1
1
1
1
1
1
1
1
1
1
1
1
1
1
1
1
1
1
1
1
1
1
1
1
1
1
1
1
1
1
1
1
1
1
1
1
1
1
1
1
1
1
1
1
1
1
1
1
1
1
1
1
1
1
1
1
1
1
1
1
1
1
1
1
1
1
1
1
1
1
1
1
1
1
1
1
1
1
1
1
1
1
1
1
1
1
1
1
1
1
1
1
1
1
1
Publication Years
1
429
1206
212
11
1
Category
779
134
124
112
110
69
26
Toolboxes
152
96
85
75
57
45
44
41
41
37
36
36
33
31
30
30
30
24
22
21
13
9
8
8
6
1

DHS Working Papers No. 101
Women’s empowerment, HIV testing, birth in past five years, Tanzania
Rwanda 2010: A Dramatic Change in Reproductive Behavior
Westoff, C.F., F. Ngabo, C. Munyanshongore, M.A. Umubyeyi, and E. Kagame
Calverton, Maryland, USA: ICF International.
(2013)
C2
DHS Further Analysis Reports No. 90 - In Rwanda, between 2005 and 2010, there have been radical declines in the desired number of children, actual fertility, and child mortality along with a large increase in contraceptive prevalence. This study reviews trends in some of these measures. Multivariate
...
analyses evaluate the relative importance for
the desired number of children of years of schooling, wealth, urban residence, media exposure, child mortality, and attitudes toward gender equality. Variations in reproductive preferences, the total fertility rate, and unmet need for family planning are mapped for the 30 districts of Rwanda. The explanations for the rapid changes in reproductive attitudes and behavior are clearly related to the concerns of the country, the rapid rate of population growth, and its implications for economic development and reproductive health.
more
DHS Methodological Report No. 20
This study used Service Provision Assessment (SPA) and Demographic and Health Survey (DHS) data from Haiti, Malawi, and Tanzania to compare traditionally used additive methods with a data reduction method—principal component analysis (PCA).
We scored ... the quality of health facilities with three approaches (simple additive, weighted additive, and PCA) for two constructs: quality of services, with only facilities-level data, and quality of care, which incorporates observation and client data. We ranked facilities as high, medium, or low quality based on their scores. Our results indicated that the rankings change with the scoring methodology. There was more consistency in the rankings of facilities by the simple additive and PCA methods than the weighted additive and PCA-based rankings. This may be due to the low factor loadings and little variance explained by the first component in the PCA. We aggregated facility scores to their respective DHS clusters (Haiti, Malawi) or regions (Tanzania) and geographically linked them to women interviewed in DHS surveys to test associations between the use of family planning services and the quality environment, as measured with each index. more
Census Report Volume 4-C
The 2014 Myanmar Census provided the opportunity to measure maternal mortality. The questions on deaths in households during the twelve months prior to the Census were included in the questionnaire, as well as questions necessary to estimate maternal mortality indicator ... s. more
The 2014 Myanmar Census provided the opportunity to measure maternal mortality. The questions on deaths in households during the twelve months prior to the Census were included in the questionnaire, as well as questions necessary to estimate maternal mortality indicator ... s. more
Undernutrition in Myanmar. Part 2: A Secondary Analysis of LIFT 2013 Household Survey Data
Zaw Win; Cashin, Jennifer
Leveraging Essential Nutrition Actions to Reduce Malnutrition (LEARN)
(2016)
C1
In order to better understand the contributing factors of undernutrition in LIFT program areas and the links between child nutritional status and independent variables of programmatic importance to LIFT (such as income, livelihoods, food security, and water, sanitation and hygiene [WASH]), LEARN com
...
missioned a secondary analysis of nutrition-related data from the 2013 LIFT Household Survey. The purpose of this report is to present the findings of this analysis.
more


Research Article
Journal of Addiction
Volume 2016, Article ID 2476164, 8 pages
http://dx.doi.org/10.1155/2016/2476164
Sudan Medical and Scientific Research Institute, Khartoum, Sudan
Received 26 November 2015; Accepted 27 January 2016
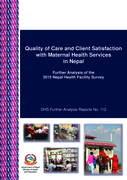
This report presents further analysis of the 2015 Nepal Health Facility Survey. Data analysis is based on the Donabedian framework for assessing quality of care in health services, which divides the indicators into three groups: structure, process, and outcome. The World Health Organization Service
...
Availability and Readiness Assessment (SARA) indicator guideline was used to assess facility service readiness, service quality and client satisfaction with maternal health services. The study performed both bivariate and multivariate regression analysis to examine the association of maternal health service readiness and quality indicators with client satisfaction.
more


The DHS report itself explains the purpose was, “to obtain and provide information on basic indicators of social progress including fertility, childhood mortality, reproductive and child health, nutritional status of children, and awareness of HIV/AIDS and other health-related issues” in PNG. Th
...
is is important because a DHS then provides the evidence base for PNG officials themselves to track progress in PNG over time, compare trends with other comparable countries, and then allocate financial and human resources to where they are needed most.
more

This Key Indicators report presents selected findings of the 2019 EMDHS. A comprehensive analysis of the data will be publishedin a final report in 2019.T he primary objective of the 2019 EMDHS project is to provide up-to-date estimates of key demographic and health indicators.
Ethiopia GATS was implemented by Ethiopia Public Health Institute (EPHI) in collaboration with the Ethiopian Food, Medicine, Health Care Administration and Control Authority (FMHACA), CSA, FMOH and the World Health Organization (WHO)country office. Technical assistance
...
for the implementation of the survey was provided by the WHO, the U.S. Centers for Disease Control and Prevention (CDC), and RTI International. Program support was provided by the CDC Foundation.Financial support for Ethiopia GATS was provided by the CDC Foundation with a grant from the Bill & Melinda Gates Foundation.GATS enhances countries’ capacity to design, implement and evaluate tobacco control programs. It also assistscountries to fulfill their obligations under the WHO FCTC to generate comparable data within and across countries. In addition,it allows countries to implement the WHO MPOWER policy package. WHO MPOWERisa technical packagedevelopedtoassist countries in implementing selected demand reduction measures contained in the WHO Framework Convention on Tobacco Control(FCTC)(5).The six MPOWER evidence-based measures contained in the FCTC;
more