Filter
3200
Text search:
maps
Featured
384
767
Language
3135
91
75
46
31
29
23
7
5
4
4
3
3
3
2
2
2
2
2
2
2
1
1
1
1
1
1
1
1
1
1
1
1
1
1
1
1
1
1
1
Document type
1329
723
506
280
156
85
36
33
20
17
5
4
2
1
Countries
202
81
63
60
54
52
51
48
45
43
43
42
42
39
34
34
33
28
26
25
24
24
23
22
22
22
21
20
19
18
18
17
17
16
15
13
13
13
12
11
11
11
11
10
10
9
9
8
8
8
7
7
7
6
6
6
6
6
6
6
5
5
5
5
5
5
5
4
4
4
4
4
4
3
3
3
3
3
3
3
3
3
3
3
2
2
2
2
2
2
2
2
2
2
2
2
2
2
2
2
2
2
2
2
2
2
2
2
2
2
2
1
1
1
1
1
1
1
1
1
1
1
1
1
1
1
1
1
1
1
1
1
1
1
1
1
1
Authors & Publishers
936
313
168
154
94
85
65
54
32
29
20
20
19
19
16
14
14
13
13
13
12
12
11
10
9
9
8
8
8
8
8
8
8
8
8
8
8
7
7
7
7
7
6
6
6
6
5
5
5
5
5
5
5
5
5
5
5
5
5
5
5
4
4
4
4
4
4
4
4
4
4
4
4
4
4
4
4
4
4
4
4
4
4
4
4
4
4
4
4
4
4
4
4
4
3
3
3
3
3
3
3
3
3
3
3
3
3
3
3
3
3
3
3
3
3
3
3
3
3
3
3
3
3
3
3
3
3
3
3
2
2
2
2
2
2
2
2
2
2
2
2
2
2
2
2
2
2
2
2
2
2
2
2
2
2
2
2
2
2
2
2
2
2
2
2
2
2
2
2
2
2
2
2
2
2
2
2
2
2
2
2
2
2
2
2
2
2
2
2
2
2
2
2
2
2
2
2
2
2
2
2
2
2
2
2
2
2
2
2
2
2
2
2
2
2
2
2
2
2
2
2
2
2
2
2
2
2
2
2
2
2
2
2
2
2
2
2
2
2
2
2
2
2
2
2
2
2
2
2
1
1
1
1
1
1
1
1
1
1
1
1
1
1
1
1
1
1
1
1
1
1
1
1
1
1
1
1
1
1
1
1
1
1
1
1
1
1
1
1
1
1
1
1
1
1
1
1
1
1
1
1
1
1
1
1
1
1
1
1
1
1
1
1
1
1
1
1
1
1
1
1
1
1
1
1
1
1
1
1
1
1
1
1
1
1
1
1
1
1
1
1
1
1
1
1
1
1
1
1
1
1
1
1
1
1
1
1
1
1
1
1
1
1
1
1
1
1
1
1
1
1
1
1
1
1
1
1
1
1
1
1
1
1
1
1
1
1
1
1
1
1
1
1
1
1
1
1
1
1
1
1
1
1
1
1
1
1
1
1
1
1
1
1
1
1
1
1
1
1
1
1
1
1
1
1
1
1
1
1
1
1
1
1
1
1
1
1
1
1
1
1
1
1
1
1
1
1
1
1
1
1
1
1
1
1
1
1
1
1
1
1
1
1
1
1
1
1
1
1
1
1
1
1
1
1
1
1
1
1
1
1
1
1
1
1
1
1
1
1
1
1
1
1
1
1
1
1
1
1
1
1
1
1
1
1
1
1
1
1
1
1
1
1
1
1
1
1
1
1
1
1
1
1
1
1
1
1
1
1
1
1
1
1
1
1
1
1
1
1
1
1
1
1
1
1
1
1
1
1
1
1
1
1
1
1
1
1
1
1
1
1
1
1
1
1
1
1
1
1
1
1
1
1
1
1
1
1
1
1
1
1
1
1
1
1
1
1
1
1
1
1
1
1
1
1
1
1
1
1
1
1
1
1
1
1
1
1
1
1
1
1
1
1
1
1
1
1
1
1
1
1
1
1
1
1
1
1
1
1
1
1
1
1
1
1
1
1
1
1
1
1
1
1
1
1
1
1
1
1
1
1
1
1
1
1
1
1
1
1
1
1
1
1
1
1
1
1
1
1
1
1
1
1
1
1
1
1
1
1
1
1
1
1
1
1
1
1
1
1
1
1
1
1
1
1
1
1
1
1
1
1
1
1
1
1
1
1
1
1
1
1
1
1
1
1
1
1
1
1
1
1
1
1
1
1
1
1
1
1
1
1
1
1
1
1
1
1
1
1
1
1
1
1
1
1
1
1
1
1
1
1
1
1
1
1
1
1
1
1
1
1
1
1
1
1
1
1
1
1
1
1
1
1
1
1
1
1
1
1
1
1
1
1
1
1
1
1
1
1
1
1
1
1
1
1
1
1
1
1
1
1
1
1
1
1
1
1
1
1
1
1
1
1
1
1
1
1
1
1
1
1
1
1
1
1
1
1
1
1
1
1
1
1
1
1
1
1
1
1
1
1
1
1
1
1
1
1
1
1
1
1
1
1
1
1
1
1
1
1
1
1
1
1
1
1
1
1
1
1
1
1
1
1
1
1
1
1
1
1
1
1
1
1
1
1
1
1
1
1
1
1
1
1
1
1
1
1
1
1
1
1
1
1
1
1
1
1
1
1
1
1
1
1
1
1
1
1
1
1
1
1
1
1
1
1
1
1
1
1
1
1
1
1
1
1
1
1
1
1
1
1
1
1
1
1
1
1
1
1
1
1
1
1
1
1
1
1
1
1
1
1
1
1
1
1
1
1
1
1
1
1
1
1
1
1
1
1
1
1
1
1
1
1
1
1
1
1
1
1
1
1
1
1
1
1
1
1
1
1
1
1
1
1
1
1
1
1
1
1
1
1
1
1
1
1
1
1
1
1
1
1
1
1
1
1
1
1
1
1
1
1
1
1
1
1
1
1
1
1
1
1
1
1
1
1
1
1
1
1
1
1
1
1
1
1
1
1
1
1
1
1
1
1
1
1
1
1
1
1
1
1
1
1
1
1
1
1
1
1
1
1
1
1
1
1
1
1
1
1
1
1
1
1
1
1
1
1
1
1
1
1
1
1
1
1
1
1
1
1
1
1
1
1
1
1
1
1
1
1
1
1
1
1
1
1
1
1
1
1
1
1
1
1
1
1
1
1
1
1
1
1
1
1
1
1
1
1
1
1
1
1
1
1
1
1
1
1
1
1
1
1
1
1
1
1
1
1
1
1
1
1
1
1
1
1
1
1
1
1
1
1
1
1
1
1
1
1
1
1
1
1
1
1
1
1
1
1
1
1
1
1
1
1
1
1
1
1
1
1
1
1
1
1
1
1
1
1
1
1
1
1
1
1
1
1
1
1
1
1
1
1
1
1
1
1
1
1
1
1
1
1
1
1
1
1
1
1
1
1
1
1
1
1
1
1
1
1
1
1
1
1
1
1
1
1
1
1
1
1
1
1
1
1
1
1
1
1
1
1
1
1
1
1
1
1
1
1
1
1
1
1
1
1
1
1
1
1
1
1
1
1
1
1
1
1
1
1
1
1
1
1
1
1
1
1
1
1
1
1
1
1
1
1
1
1
1
1
1
1
1
1
1
1
1
1
1
1
1
1
1
1
1
1
1
1
1
1
1
1
1
1
1
1
1
1
1
1
1
1
1
1
1
1
1
1
1
1
1
1
1
1
1
1
1
1
1
1
1
1
1
1
1
1
1
1
1
1
1
1
1
1
1
1
1
1
1
1
1
1
1
1
1
1
1
1
1
1
1
1
1
1
1
1
1
1
1
1
1
1
1
1
1
1
1
1
1
1
1
1
1
1
1
1
1
1
1
1
1
1
1
1
1
1
1
1
1
1
1
1
1
1
1
1
1
1
1
1
1
1
1
1
1
1
1
1
1
1
1
1
1
1
1
1
1
1
1
1
1
1
1
1
1
1
1
1
1
1
1
1
1
1
1
1
1
1
1
1
1
1
1
1
1
1
1
1
1
1
1
1
1
1
1
1
1
1
1
1
1
1
1
1
1
1
1
1
1
1
1
1
1
1
1
1
1
1
1
1
1
1
1
1
1
1
1
1
1
1
1
1
1
1
1
1
1
1
1
1
1
1
1
1
1
1
1
1
1
1
1
1
1
1
1
1
1
1
1
1
1
1
1
1
1
1
1
1
1
1
1
1
1
1
1
1
1
1
1
1
1
1
1
1
1
1
1
1
1
1
1
1
1
1
1
1
1
1
1
1
1
1
1
1
1
1
1
1
1
1
1
1
1
1
1
1
1
1
1
1
1
1
1
1
1
1
1
1
1
1
1
1
1
1
1
1
1
1
1
1
1
1
1
1
1
1
1
1
1
1
1
1
1
1
1
1
1
1
1
1
1
1
1
1
1
1
1
1
1
1
1
1
1
1
1
1
1
1
1
1
1
1
1
1
1
1
1
1
1
1
1
1
1
1
1
1
1
1
1
1
1
1
1
1
1
1
1
1
1
1
1
1
1
1
1
1
1
1
1
1
1
1
1
1
1
1
1
1
1
1
1
1
1
1
1
1
1
1
1
1
1
1
1
1
1
1
1
1
1
1
1
1
1
1
1
1
1
1
1
1
1
1
1
1
1
1
1
1
1
1
1
1
1
1
1
1
1
1
1
1
1
1
1
1
1
1
1
1
1
1
1
1
1
1
1
1
1
1
1
Publication Years
1229
1719
243
8
1
Category
736
381
287
275
257
88
69
Toolboxes
216
198
193
192
189
114
110
107
104
104
103
93
81
78
67
67
63
56
52
43
39
30
29
23
3
2
2
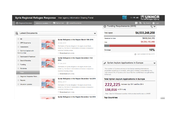
Find the latest information, guidelines or maps in English, French or Arabic
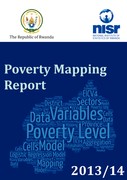
This report complements the previous poverty analysis studies by presenting a series of poverty maps of Rwanda at cell and sector levels, based on data from EICV4 and the 2012 Population and Housing Census. A poverty map is simply a map that shows t
...
he incidence of poverty in different areas of the country. It allows the viewer to appreciate, at a glance, the geographic dimensions of poverty. Apart from their intrinsic interest, poverty maps may be used to help guide the allocation of resources across local agencies or governmental units, in an effort to better target efforts to reach the poor by pinpointing the small areas of most need.
In 2015, the National Institute of Statistics of Rwanda (NISR) published the Rwanda Poverty Profile Report which provided a detailed portrait of the extent and nature of poverty in the country, while in 2016 a Poverty Trends Analysis Report which complements the Profile study by looking at the trends in poverty between 2010/11 and 2013/14 was also published. Both reports were based on information collected by an integrated household living conditions survey (EICV4) undertaken between October 2013 and September 2014.
more
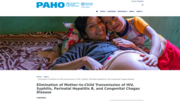
Resource Website with fact sheets, maps and dashboards, and related resources
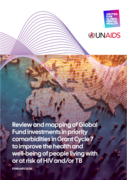
This report developed by UNAIDS and the United for Global Mental Health reviews and maps Global Fund investments in priority HIV and TB comorbidities in Grant Cycle 7 (GC7), including key non-communicable diseases (NCDs), cervical, anorectal and ot
...
her cancers, and mental health and substance use conditions. It highlights how countries prioritize and are integrating health services and other interventions with HIV and TB programmes to advance person-centered approaches and to sustain HIV and TB responses. Analyzing approved grants from 103 countries, the report finds strong demand for integrated approaches, with 97% of countries prioritizing at least one comorbidity.
more
On this platform you will find the latest figures, maps and situation reports http://data.unhcr.org/SouthSudan/regional.php

Getting story ideas right -- Getting your sources right -- Getting your facts right -- Getting your report right -- Getting images and videos verified accurately -- Getting maps right -- Getting your language right

Now available in an interactive map journal that shows the evolution of the outbreak and the global response. Please download the latest version from the website
http://apps.who.int/ebola/en/current-situation/ebola-maps
Homepage of the United Nations Office for the Coordination of Humanitarian Affairs on Syria with Situation Reports, Fact Sheets, Maps, Infographics...
Technical Update
Areas of Africa endemic for Buruli ulcer (BU), caused by Mycobacterium ulcerans, also have a high prevalence of human immunodeficiency virus (HIV), with adult prevalence rates between 1% and 5% (Maps). However, there is limited inf
...
ormation on the prevalence of BU–HIV coinfection. Preliminary
evidence suggests that HIV infection may increase the risk of BU disease (1–3). In the Médecins Sans Frontières project in Akonolinga, Cameroon, HIV prevalence was approximately 3–6 times higher among BU patients than the regional estimated HIV prevalence (2). Similarly in Benin and Ghana, BU
patients were 8 times and 3 times respectively more likely to have HIV infection than those without BU (1, 3). Further study is needed to clarify this association and enhance knowledge about the prevalence ofBU–HIV coinfection in endemic areas.
more
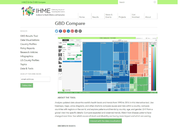
Global Burden of Disease (GBD) Compare
recommended
Institute for Health Metrics and Evaluation
(2018)
CC
Analyze updated data about the world’s health levels and trends from 1990 to 2016 in this interactive tool. Use treemaps, maps, arrow diagrams, and other charts to compare causes and risks within a country, compare countries with regions or the wo
...
rld, and explore patterns and trends by country, age, and gender. Drill from a global view into specific details. Compare expected and observed trends. Watch how disease patterns have changed over time. See which causes of death and disability are having more impact and which are waning.
more

Global Burden of Disease (GBD) India Compare
recommended
Analyze data about India’s health levels and trends from 1990 to 2016 in this interactive tool. Use treemaps, maps, arrow diagrams, and other charts to compare causes and risks and explore patterns and trends by age and sex. Drill from a national
...
view into specific details. Compare expected and observed trends. Watch how disease patterns have changed over time. See which causes of death and disability are having more impact and which are waning.
more
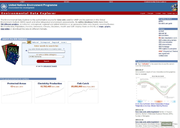
The Environmental Data Explorer is the authoritative source for data sets used by UNEP and its partners in the Global Environment Outlook (GEO) report and other integrated environment assessments. Its online database holds more than 500 different variables, as national, subregional, regional and glo
...
bal statistics or as geospatial data sets (maps), covering themes like Freshwater, Population, Forests, Emissions, Climate, Disasters, Health and GDP. Display them on-the-fly as maps, graphs, data tables or download the data in different formats.
more
Epi Info™ is a public domain suite of interoperable software tools designed for the global community of public health practitioners and researchers. It provides for easy data entry form and database construction, a customized data entry experience, and data analyses with epidemiologic statistics,
...
maps, and graphs for public health professionals who may lack an information technology background. Epi Info™ is used for outbreak investigations; for developing small to mid-sized disease surveillance systems; as analysis, visualization, and reporting (AVR) components of larger systems; and in the continuing education in the science of epidemiology and public health analytic methods at schools of public health around the world.
more

Close to 800 000 people die due to suicide every year, which is one person every 40 seconds. Suicide is a global phenomenon and occurs throughout the lifespan. Effective and evidence-based interventions can be implemented at population, sub-population and individual levels to prevent suicide and sui
...
cide attempts. There are indications that for each adult who died by suicide there may have been more than 20 others attempting suicide.
On this website you can download maps, data, graphics by region or country
more
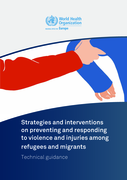
This technical guidance outlines current evidence, knowledge and best practice relating to incidences of violence and injuries among refugees and migrants in the WHO European Region. It highlights key principles, summarizes priority actions and challenges,
...
maps existing international commitments and frameworks and provides practical policy considerations for preventing and responding to such challenges. Specific areas for intervention include ensuring safe passage for migration; addressing causes of violence and injuries in transit and destination countries, including changing norms and values; identifying victims and providing care and protection; investigating and prosecuting perpetrators; and strengthening the knowledge base. While the main intended audience of this technical guidance series are policy-makers across sectors at local, national and regional levels, the contents of this publication will also be of value for health-care practitioners and law enforcement and border protection officials.
more
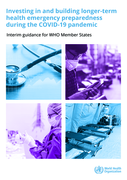
Investing in and building longer-term health emergency preparedness during the COVID-19 pandemic
recommended
Interim Guidance
This document is to help Member States build on actions taken during the COVID-19 pandemic to improve national medium- to long-term preparedness for future threats. It maps COVID-19 preparedness and response actions to the building
...
of sustainable International Health Regulations (2005) core capacities; locates relevant supporting WHO resources that are not specific to the pandemic; and advocates for the conscious and effective allocation of COVID-19 funds to also meet countries’ longer-term need
more
This guide includes sections dedicated to Lebanon, AUB and AUBMC. In addition to international and regional academic sources and articles, the guide includes webinars, reports, maps, videos, and a section for Faculty, Staff and Students highlighting
...
the available online tools & resources to continue their respective tasks from home. Mental Health management and TeleHealth have been highlighted as well, in addition to a section for Open Educational Resources, one for information on the Vaccine as well as the effect of this outbreak on the Economy.
more

Soil transmitted helminth (STH) infections are among the most common human infections worldwide with over 1 billion people affected. Many estimates of STH infection are often based on school-aged children (SAC). This study produced predictive risk-maps
...
of STH on a more finite scale, estimated the number of people infected, and the amount of drug required for preventive chemotherapy (PC) in Ogun state, Nigeria. Georeferenced STH infection data obtained from a cross-sectional survey at 33 locations between July 2016 and November 2018, together with remotely-sensed environmental and socio-economic data were analyzed using Bayesian geostatistical modelling. Stepwise variable selection procedure was employed to select a parsimonious set of predictors to predict risk and spatial distribution of STH infections. The number of persons (pre-school ages children, SAC and adults) infected with STH were estimated, with the amount of tablets needed for preventive chemotherapy. An overall prevalence of 17.2% (95% CI 14.9, 19.5) was recorded for any STH infection. Ascaris lumbricoides infections was the most predominant, with an overall prevalence of 13.6% (95% CI 11.5, 15.7), while Hookworm and Trichuris trichiura had overall prevalence of 4.6% (95% CI 3.3, 5.9) and 1.7% (95% CI 0.9, 2.4), respectively. The model-based prevalence predictions ranged from 5.0 to 23.8% for Ascaris lumbricoides, from 2.0 to 14.5% for hookworms, and from 0.1 to 5.7% for Trichuris trichiura across the implementation units. The predictive maps revealed a spatial pattern of high risk in the central, western and on the border of Republic of Benin. The model identified soil pH, soil moisture and elevation as the main predictors of infection for A. lumbricoides, Hookworms and T. trichiura respectively. About 50% (10/20) of the implementation units require biannual rounds of mass drug administration. Approximately, a total of 1.1 million persons were infected and require 7.8 million doses. However, a sub-total of 375,374 SAC were estimated to be infected, requiring 2.7 million doses. Our predictive risk maps and estimated PC needs provide useful information for the elimination of STH, either for resource acquisition or identifying priority areas for delivery of interventions in Ogun State, Nigeria.
more

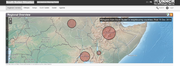
With an estimated population of about 5 million and an annual growth rate of 8 per cent, Dar es Salaam, Tanzania, is Africa’s fastest growing city.1 Over 70 per cent of the people live in informal, unplanned settlements with inadequate infrastructure. In addition, heavy rainfalls twice a year
...
result in signifi cant fl ood risks. The objectives in Dar es Salaam were to 1) obtain high quality and up to date exposure maps of aff ected communities and as a stretch goal 2) to create a hydrological model using elevation data. Both of these would form important elements to managing fl ood risks but neither had been previously available due to a lack of high quality digital imagery
more

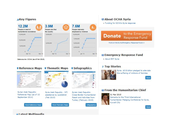
The free App empowers individuals to learn about Ebola; separating fact from fiction, especially in these uncertain times. Ebola – What you need to know provides users on-the-go with easy to access information – available 24/7, both online and offline
Available for download on Android and
...
Apple iOS, key features include:
Latest news and development on Ebola
Outbreak outlook
Maps showing affected areas
Live International SOS twitter feed
Educational video on staying safe whilst travelling
Push notifications for key information to keep you informed and safe
Access to the International SOS Ebola website with downloadable resources
more