Filter
12214
Filtered Results: 12214
Text search:
report
Featured
Recommendations
892
New Publications
4474
Language
Document type
No document type
7100
Studies & Reports
2219
Guidelines
1256
Manuals
501
Strategic & Response Plan
378
Fact sheets
292
Situation Updates
183
Training Material
175
Resource Platforms
44
Infographics
35
Brochures
20
Online Courses
7
Dashboards/Maps
3
App
1
Countries / Regions
India
483
Global
390
Kenya
340
Ethiopia
252
Sierra Leone
245
Western and Central Europe
242
South Africa
229
Nepal
224
Nigeria
223
Liberia
223
Latin America and the Carribbean
222
Uganda
218
Myanmar / Burma
213
Rwanda
173
Syria
171
Bangladesh
166
Zambia
164
Congo, Democratic Republic of
163
Ukraine
156
Tanzania
150
Africa
146
Ghana
137
Malawi
130
Venezuela
105
Eastern Europe
105
Germany
104
Mozambique
103
Senegal
102
Russia
100
Indonesia
98
Philippines
94
Brazil
91
South Sudan
91
Namibia
85
Haiti
84
Yemen
82
Burkina Faso
81
Zimbabwe
79
Cambodia
79
Lesotho
77
Guinea
76
Colombia
71
Asia
66
West and Central Africa
66
South–East Asia Region
66
Cameroon
65
East and Southern Africa
54
Middle East and North Africa
53
Benin
51
Eastern Europe and Central Asia
48
Botswana
48
Paraguay
46
Central African Republic
44
Afghanistan
39
Pakistan
39
Peru
37
Argentina
36
Madagascar
35
Eswatini/ Swaziland
35
Mali
33
Somalia
31
Jordan
29
Sudan
29
Lebanon
28
Bolivia
24
Tajikistan
23
Chile
23
Angola
23
Thailand
22
USA
22
Ecuador
22
Côte d’Ivoire / Ivory Coast
20
Iraq
20
Western Pacific Region
19
Vietnam
19
China
18
Albania
17
Moldova
15
Guinea-Bissau
14
Sri Lanka
14
Turkey
13
Laos
13
Niger
13
Georgia
13
Togo
12
El Salvador
11
Kyrgyzstan
11
Southern Africa
11
Libya
11
North Macedonia
10
Iran
10
Burundi
10
Italy
10
Spain
10
Papua New Guinea
10
Palestine
10
Mexico
9
Greece
9
Kazakhstan
8
Armenia
8
Egypt
8
Saudi Arabia
7
Romania
7
Poland
7
Chad
7
Bhutan
7
Guatemala
7
Timor Leste/ East Timor
6
Gambia
6
Uzbekistan
6
Hungary
6
Jamaica
6
United Kingdom
6
Portugal
6
Serbia
5
Morocco
5
Turkmenistan
5
Tunisia
5
Honduras
5
Switzerland
4
Canada
4
Malaysia
4
Dominican Republic
4
North America
4
Uruguay
4
France
4
Belarus
4
Djibouti
4
Singapore
3
Estonia
3
Congo-Brazzaville
3
Croatia
3
Gabon
3
Japan
3
Mauritius
3
Bosnia and Herzegovina
3
Australia
2
Austria
2
Vanuatu
2
Qatar
2
Bulgaria
2
Mauritania
2
Lithuania
2
Belgium
2
Azerbaijan
2
Israel
2
Nicaragua
2
Slovakia
2
North Korea
1
Fiji
1
Mongolia
1
Ireland
1
Denmark
1
Maldives
1
Norway
1
Algeria
1
French Guyana
1
Latvia
1
Solomon Islands
1
Cuba
1
Authors & Publishers
Publication Years
Category
Studies & Reports
1166
Policies
665
Guidelines
603
COVID-19
566
Policies & Guidelines HIV & TB
527
Women & Child Health
509
Statistics
413
Humanitarian Crisis
387
Community Health
309
Demograhic Health Surveys DHS
306
Capacity Building
285
Drugs & Medical Equipment
230
Disabilities
218
Humanitarian Aid
147
Disease Prevention & Control
115
Maternal Health
104
Countries
102
General Guidelines
96
Disaster Preparedness
89
Pediatrics
82
Food Security & Nutrition
82
Protection & Security
77
Reproductive Health
75
Child Health
71
Gynaecology & Obstetrics
71
Community Health
67
WASH
67
Needs Assessment
62
TB
62
Under-5 nutrition
61
HIV & STI
61
Child protection
58
Infection Control & Prevention (IPC)
56
Information, Education and Communication (IEC)
56
Paediatrics
48
Maternal & Child Health
47
Sexual Violence
47
Vaccine-preventable Diseases
46
Other
46
Malaria
44
Age & Elderly
43
Neonatal Care
43
Primary Health Care
41
Health Systems
39
Mental Health
38
Key Resources
36
Women & Child Health
35
Family Planning
34
NCD
32
Surgery & Anaesthesia
32
Female Genital Mutilation
32
NTDs & Others
32
Water
30
Hepatitis
28
Monitoring & Evaluation
28
Public Health
27
Physiotherapy & Rehabilitation
27
Communicable Diseases
26
Immunization
26
Vector Control
25
Palliative Care
25
Global Health
25
Hand Hygiene
23
Water, Sanitation and Hygiene (WASH)
23
Non-communicable Diseases
23
Cancer
21
General Guidelines
21
Chagas
21
Cardiovascular Diseases
21
Palliative Care
21
Sanitation
20
Diabetes
19
Hygiene Promotion
18
Humanitarian Aid
17
Violence against Children
17
Clinical Guidelines
17
Nutrition
17
Leishmaniasis
17
Laboratory Quality Assurance
17
Public Health
16
x MEDBOX Issue Brief & Annual Reports x
15
Health System Strengthening
15
Parasitology
15
Dental & Eye Care
14
Clinical Training
14
Bacteriology
14
Virology
14
Medical Devices & Equipment
14
Leprosy
14
Gender
13
Hemorrhagic Fever
13
Yellow Fever
13
Waste Management
13
Respiratory Infections
13
Quality Control & Assurance
13
Communicable Diseases
13
Diarrhoeal Disease/Cholera
12
Digital Health
11
Cervical Cancer
11
Cancer Treatment & Resources
11
Training Manuals
11
Leprosy
11
Pharmacy & Technologies
11
Rabies
10
Project Cycle Management
9
MPOX - Monkeypox
9
Sex. & Repr. Rights
9
Menstrual Hygiene Management
9
Pharmacy & Technology
8
Buruli Ulcer
8
Pharmaceutical Assessments
8
Dengue
8
Snakebites
7
Yersinia pestis (Plague)
7
Neurology & Psychology
7
Helminthiasis
6
Trachoma
6
Schistosomiasis
6
Dermatology
6
Breast Cancer
6
Diarrhoea
6
Online Courses & Platforms
5
Lymphaticfilariasis
5
Laboratory Waste
5
Maternal Health
5
Hematology
4
Annual Report MEDBOX
4
Pediatric cancer
4
Disabilities & Inclusion
4
Radiology and Diagnostic
4
Zika
3
Yaws
3
Taeniasis/ Cysticercosis
3
Neurology & Psychology
3
Other Cancer diseases
3
Emergency Care
3
Human African Trypanosomiasis
3
Medicines Donations
2
Emergency Health Kits
2
Onchocerciasis
2
Capacity Building
2
Non-communicable Diseases NCD
2
Disabilities
2
Mental Health
2
COVID-19
2
IEC Material
2
Fecal Disposal / Latrines
2
Online Courses Platforms
1
Planetary Health
1
Nutrition
1
Neglected Tropcial Diseases NTDs
1
Community Health
1
E-therapy
1
COPD/Asthma
1
Laboratory Technologies
1
Toolboxes
Country specific documents
398
Reports & Studies
203
Children/Adolescents Mental Disorders
156
Eastern Europe and central Asia
128
Assessment & Studies
125
Substance Use Disorders & Addiction
122
IACAPAP International Association for Child and Adolescent Psychiatry and Allied Professions
115
Global Impact: Socio-economic, health services, TB & HIV
110
Children & Adolescents
99
Assessment & Response
95
Infection Control General
91
Clinical Guidelines
87
Country specific
83
Public Health
77
HIV in Key Populations
75
Neurological Disorders
68
Climate Change General
67
Climate & Health
63
Education
61
Detection & Diagnosis
60
Psychosocial Support (MHPSS)
57
Children with Disabilities
57
Substance Use Disorders, Others
57
General Studies & Reports
56
TB & Prisoners
56
Prevention & Control
55
Health Financing Toolbox
54
Planetary Health
53
Hospital Readiness/Essential Health Services
51
Policies
50
Prevention & Preparedness
50
Preparedness & Prevention
50
War & Conflict
49
Roadmaps, Action Plans & Policies
49
Alcohol
48
Children's Rights
48
Drug resistant TB
48
General Information & Methodology
47
International
47
Social Mobilisation
46
Community Health Workers CHW
46
Assessment & Response
46
International
45
Policies & Programmes
43
Psychosocial Support
43
others
43
General Reports
42
Surveillance
42
Policy
42
Studies & Reports
41
Situation Reports & Updates
41
Situation Reports & Updates
41
Alzheimer's Disease & Dementia
41
Human Rights
40
Community-based Mental Health Care
40
HIV testing & services
39
Children
38
Assessment & Response
37
TB & Other Vulnerable Populations
37
Health & Refugee
37
Protection of Vulnerable Groups
37
War, Conflict Areas & Refugees
37
Adults
36
Handbooks & Manuals
36
Health Impact & Climate Change
36
Latin America & the Carribean
36
Treatment & Prevention
35
Children with disabilities
35
Eastern Europe
35
Child Protection
35
Urban health
35
TB/HIV Coinfection
35
Lobby and Advocacy
35
Clinical Aspects, Treatment & Prevention
34
Tobacco
34
Discrimination & Stigma
33
Diagnostics & Laboratory Guidance
33
Surveillance & Contact tracing
33
Reports
33
Infection Control
33
IPC
32
Europe
32
Epilepsy
31
Appeals and Response Plans
31
Nurses
31
Rational use of Medicine
31
General Information
31
Disease Prevention & Control
31
Disability Rights & Convention
30
Context, Facts & Travel Advice
30
Laboratory
30
Studies
30
Educational Settings
30
Research & Access
30
Africa
29
Mental Health
29
Waste Managment
29
General
29
Training & Capacity Building
29
Human Rights, Stigma & Discrimination
28
Inclusion
28
Infection Prevention & Hygiene
28
Global Overview
28
Protection
28
Disaster Preparedness & Prevention
28
Testing Guidelines
28
Antiretroviral Treatment ART
28
Community Based Rehabilitation (CBR)
28
Humanitarian Crisis
27
Africa
27
Global
27
For Health Worker
27
Gender Aspects
27
Child Protection
27
Guiding documents and principles
27
Overview, Studies & Reports
27
Situation Reports & Updates
27
Self-harm & Suicide
27
Outbreak Prevention & Control
26
Key Resources
26
Training Manuals
26
Communication & Training
26
Latin America
26
Children
26
Mental Health Guidelines
26
Sustainable Development Goals
26
Treatment Guidelines
26
Paediatrics
26
RCCE Guides & Manuals
26
Access & Strategy
26
Overview & reports
26
MHPSS Guidelines
26
Depression
26
Ebola Prevention & Control
25
Reports
25
Studies & Reports
25
Midwives
25
WASH Water Sanitation & Hygiene
25
Asia and Pacific
25
Studies & Reports
25
Others
24
Mental Health Studies & Reports
24
Universal Health Coverage UHC and 90-90-90 Strategy
24
General
24
Human Rights
24
Preparedness, Response & Risk Communication
24
Pharmacy Practice
24
Pediatrics
24
Assessment & Response
24
Neurological disorders, Others
24
Inclusion in Humanitarian Settings
23
General Mental Health Guidelines
23
Toolkit on disability for Africa
23
For General Public & Community
23
Communication Material
23
Advocacy & Communication
23
Supply Chain & Store Management
23
Women
23
Asia
23
Training
23
Assessment
23
Mental Health GAP Action Programme
23
Universal Health Coverage & Primary Health Care
23
Cyclones Idai & Kenneth
23
Policies & Strategies
22
Inclusion
22
Training Supporting Material mhGAP
22
Tips & Best Practice Examples
22
Immunization Guidelines
22
Fair Allocation & Ethical Aspects
22
Vaccine Hesitancy & Myths
22
Clean air
22
Essential Medicines & Devices Lists
22
Disaster, Migration and Conflict
22
Reports & Studies Children HIV
22
Action Plans, Policies & Response
22
Best Practice Models
21
Surveillance
21
Influenza Prevention & Control
21
Diagnosis & Treatment PTSD in Children
21
Manuals
21
Context & Facts, Travel Advice
21
Hand Hygiene
21
PPE Personel Protective Equipment
21
Situation Reports COVID-19
21
Health Promotion
21
Traditional & Herbal Medicines
21
General documents One Health
21
Humanitarian Crisis
21
Asia
21
Eastern Europe & Central Asia
21
Eastern and Southern Africa
21
Food & Nutrition
21
Sexual and gender-based violence (SGBV)
20
Childhood TB
20
Situation Reports & Updates
20
For Older People
20
Others
20
Women & Maternal Health
20
Guidelines & Manuals
20
Assistive devices & technologies
20
Psychosocial Support
20
Violence & Child Trafficking
19
Gynaecology / Obstetrics
19
Background PTSD in children
19
Preparedness, Response & Risk Communication
19
Violence & Protection
19
Germany
19
HIV
19
Training
19
For Migrants & Refugees
19
Colombia
19
Zoonoses
19
For Community Health Workers
19
Prevention of mother-to-child transmission (PMTCT)
19
ART Drug Resistance
18
Agriculture & Veterinary
18
Clinical Aspects
18
Studies & Reports
18
Shelter & Reconstruction
18
Posttraumatic Stress Disorder in Children
18
Risk Communication & Community Engagement
18
Food and Nutrition
18
Mythbusters/Misinformation
18
Biodiversity shift
18
Essential Medicines
18
Mental Disorders
18
Postexposure Prophylaxis (PEP), Pre-Exposure Prophylaxis (PrEP)
18
Overview & Statistics
18
Cholera Prevention & Control
17
Research
17
Medical professionals
17
General
17
Health Personnel
17
Guidelines
17
HIV and COVID-19
17
Primary Care
17
Quality Assurance
17
Epilepsy
17
Situation Reports & Updates
17
Planetary Health
17
Intellectual Disability
16
Vaccines & Immunization
16
El Niño
16
Training, others
16
Pharmacovigilance
16
Reports & Studies
16
General
16
Infectious Diseases
16
MPOX - Monkeypox
16
Anxiety Disorders
16
Natural Disaster
15
Male Circumcision
15
People who injecting Drugs
15
Advocacy
15
Cannabis
15
Supporting tools
15
For Parents & Children
15
Children & Mental Health
15
Community Health
15
Long COVID/ Post-COVID Syndrome
15
Hygiene
15
Palliative Care
15
Health Care Systems
15
Antimicrobial Resistance (AMR)
15
Access to treatment and laboratory
15
General
15
TB/HIV Global
15
Vision Loss & Blindness
15
Zika Prevention & Control
15
Epidemiology
15
Capacity Building
15
SEAR (South-east Asia Region)
15
Drugs
14
Posttraumatic stress disorder Adults
14
Policies & Strategies
14
WASH
14
Social Worker
14
Curricula & Core Competencies
14
IEC Substance Use Disorders
14
Context & Facts
14
COVID-19
14
Camps and Camp-like Settings
14
Oxygen Therapy
14
Essential Medicines & Medical Devices
14
Agriculture
14
Studies & Reports
14
Health Worker
14
General
14
Policies and guidelines
14
Mental disorders, others
14
TB & Drug Abuse
13
Mental Health
13
HIV testing & disclosure
13
Opoids
13
Treatment Guidelines HIV
13
Sitreps & Updates
13
Medical & Community Masks
13
TB/HIV
13
Waste Management
13
General Guidelines for Rational Use
13
Others
13
Heat
13
Hearing Loss & Deafness
13
Bipolar Affective Disorders
13
Malnutrition
13
HIV service delivery
13
Guidelines CBR
13
Global Health Financing
13
Unaccompanied Refugee Minors
13
Situation Reports, others
13
HIV in Children and mental health
12
Moldova
12
Faith-based Organizations
12
Physiotherapy & Rehabilitation
12
Prevention Guidelines
12
Interculturality
12
Transgender People
12
Men who have sex with men (MSM)
12
Women's Mental Health
12
Covid-19 & the One Health Approach
12
Country Specific
12
Mental Health
12
TB/COVID-19
12
Pharmacy Management
12
HIV &TB
12
Ethics
12
Nuclear & Chemical Hazards
12
Chagas
12
Clinical Aspects & Diagnostics
12
Conflict
12
Community Worker
12
Stewardship
12
Situation Reports
12
Public Health Administration
12
Clinical Guidelines
12
AmR (Region of Americas)
12
Urban Health
12
Treatment Guidelines
11
Communication & Training
11
Statistics & Data
11
Ukraine
11
Orphans & vulnerable children
11
Physiotherapy & Rehabilitation
11
Health Equity & Equality
11
Clinical Guidelines
11
COVID-19
11
Health Care Professionals & Spirituality
11
Genomic sequencing
11
Standard Operating Procedure (SOP)
11
Humanitarian Aid Guidelines
11
Global Impact of war
11
MOPX - Monkeypox
11
Studies & Reports
11
Patient Safety
11
War Surgery & Wound Care
11
Human Rights & the Right to Health
11
TB
11
Preparedness & Prevention
11
Volunteers
11
Behaviour Change/Life Skill Education
10
Global Mental Health
10
HIV surveillance
10
Opportunistic Infections
10
Context & Facts
10
Schizophrenia
10
Measures ICF/ Model Disability Survey
10
Latin America
10
Clinical Guidelines
10
Yemen
10
Stress
10
Sex Worker
10
Situation Reports & Updates
10
For Pregnant Women
10
For People with Disabilities
10
Prison & Detention
10
General
10
Long-term Care Facilities
10
Vaxzevria (Astra Zeneca)
10
Advocacy
10
Food environments
10
Falsified & Substandard
10
Strategies
10
Land-system change
10
Clinical Aspects & Diagnostics
10
Studies & Reports
10
Vector control
10
Romania
10
Autism
10
General Aspects
10
One Health
10
Nutrition
10
Dengue Prevention & Control
10
WASH
10
Psychosocial Support
10
Safe Burials
10
Prisoners
10
Situation Reports & Updates
10
Gender Aspects
9
Meningitis Prevention & Control
9
Laboratory Guidance
9
Accessibility
9
Plague Situation Reports
9
Chemical Attacks
9
Introduction to Global Health
9
South Sudan
9
Influenza
9
Refugee
9
Wheelchair Service and Management
9
Stroke
9
Technical Information
9
Syria
9
PPE Personel Protective Equipment
9
Sexual Abuse
9
Key Resources
9
Sustainability
9
Logistics & Supply
9
SARS-CoV-2 Variants
9
Ethics
9
Situation Reports& Updates
9
Freshwater use
9
Agriculture incl. animal husbandry
9
Climate Change
9
Environment
9
Non-communicable Diseases NCD
9
Best Practice Examples
9
Studies & Reports
9
Education of students & professionals
9
Situation Reports & Updates
9
Travel Medicine
9
Best Practice Examples
9
WASH
9
Paediatrics
9
Kenya
9
Local Action
8
Natural Disasters
8
Laboratory
8
Rwanda
8
Ebola
8
Preparedness, Response & Risk Communication
8
Faith-based Organizations
8
Scientific & Research Studies
8
Physical Distancing
8
Child Friendly Spaces (CFS)
8
MHPSS – Psychosocial Support
8
Blood Supply
8
Children & Mental Health
8
COVID-19 Vaccination
8
Non-pharmaceutical interventions (NPIs)
8
Hand Hygiene
8
Others
8
Green & healthy living
8
Pharmaceutical Assessments
8
Public Health
8
Mental Health
8
Health Care In Conflict Settings
8
Appeals & Response Plans
8
Leishmaniasis
8
Studies & Reports
8
Clinical Guidelines
8
Training Material
8
Cerebral Palsy
8
Malawi
8
HIV and coinfection
8
South-east Asia Region
8
Refugees & Migrants
8
Social Determinants of Health
8
Capacity Building
8
Risk Communication & Community Engagement
8
Plague Prevention & Control
8
Hand Hygiene
7
Yellow Fever Prevention & Control
7
Explosives
7
South Africa
7
Eastern Mediterranean Region
7
National Policies
7
Legislative Texts
7
mhGAP Guides
7
Diverse Chemical Substances
7
For Health Professionals
7
Tools for Rational use
7
Vaccination
7
Mozambique
7
Country Guidelines
7
Laboratory & Sampling
7
Livestock production
7
Online Courses & Resources
7
Risk Communication & Community Engagement
7
Simulations
7
Workplace
7
LGBTI*
7
Palliative Care
7
Coping with Stress
7
At Home
7
Biontech/Pfizer Comirnaty
7
Stress
7
Overview
7
Mobility
7
Resuscitation
7
Argentina
7
Others
7
Education Principles
7
Water Pollution
7
Strategies & Roadmaps
7
Clinical Aspects & Diagnostics
7
Studies & Reports
7
Prevention & Control
7
Official Development Assistance
7
Technical Information
7
Ghana
7
Uganda
7
Health Care Systems
7
IEC
7
Nigeria
7
Chikungunya Prevention & Control
7
Western & Central Europe
7
Meningitis & Encephalitis
7
Public Health
7
Public Health
6
Cholera Situation Reports
6
Cocaine
6
Communication & Training
6
Yellow Fever
6
Surgery & Rehabilitation
6
Assessment & Response
6
Infection Control
6
Namibia
6
Drug resistance
6
Stigma & Discrimination
6
TB
6
Training Material
6
Adherence
6
Drug resistance
6
Clinical aspects
6
Microcephaly
6
Training
6
Manual & Leaflet
6
Latin America
6
Ebola Treatment Center
6
Presentation
6
Structural Violence
6
Others
6
Extreme Situations
6
Peru
6
Food & Nutrition
6
Prices and Patents
6
Spirituality
6
Intensive Care Unit
6
Statistics & Facts
6
Studies & Reports
6
Studies & Reports
6
Studies & Reports
6
NTDs General
6
Snakebite envenoming
6
Databases & Maps
6
Co-Morbidities (except TB)
6
Prophylactic Treatment
6
Diarrhoea
6
IEC Materials Children
6
Yellow Fever Situation Report
6
Global Health Institutions and Stakeholders
6
Europe
6
Public Health
6
Reproductive Health
6
People with Handicaps
5
Physical Disability
5
International
5
WPRO (Western Pacific Region)
5
Training Manuals
5
Hepatitis
5
Videos & Online Courses
5
Germany
5
South Sudan
5
Ebola
5
Georgia
5
Ethiopia
5
Topics
5
COVID-19
5
COVID-19 Information
5
Dashboards & Maps
5
Information for the Public
5
Resource Platforms others
5
Country-specific Platforms
5
Option for the Poor
5
COVAX Initiative
5
Moderna
5
Sanitation
5
Brazil
5
Planetary Boundaries
5
Surgery
5
Prevention & Measures
5
General
5
Planetary Boundaries Overview
5
Capacity Building & Resources
5
Clinical Aspects & Diagnostics
5
Information & Education Material (IEC)
5
Studies & Reports
5
Clinical Aspects & Diagnostics
5
Leptospirosis
5
Mycetoma, Chromoblastomycosis & other deep mycosis
5
Onchocerciasis
5
Domestic Resource Mobilization
5
Community Based Rehabilitation (CBR)
5
CBM Inclusive Project Cycle Management Training
5
Contact Tracing
5
Policies & Strategies
5
National Emergency Response Plans
5
Prevention
5
Urbanization
5
IEC Material Children HIV
5
Germany
5
Others
5
Tajikistan
5
Epidemiology
5
Cholera
5
Learning Disabilities
5
Global Health Action
5
Pregnant women
5
Global Health Ethics
5
Communication & Social Mobilisation
4
Health Systems
4
Advocacy
4
IEC Materials General
4
Training
4
Azerbaijan
4
Dental Health
4
Vector Control
4
Early Warning
4
Training
4
Early Warning
4
For Project Management
4
Platforms and initiatives
4
Public Health
4
Concepts of Global Health
4
Surveillance
4
Prevention & Control
4
SOPs
4
Standard Precautions
4
Attention deficit hyperactivity disorder (ADHD)
4
Workplace
4
Mental Health Online Resources
4
HIV / AIDS
4
Russia
4
Key Resources
4
Clinical Guidelines
4
Essential List
4
Clinical Aspects
4
Information Material &Training
4
Covid-19 & Climate Change
4
COVID-19
4
General Background
4
Pastoral Care
4
Infection Control & Prevention (IPC)
4
Gambling
4
Research & Pipeline
4
Self-care
4
Others
4
Estonia
4
El Salvador
4
Medical Records/Documentation
4
Resources Kreyol Earthquake Haiti
4
Guidelines General
4
Booster Doses
4
Ecuador
4
Cancer
4
Biogeochemical flows
4
One Health
4
Ukraine
4
Waste management
4
MPOX -Monkeybox Prevention & Control
4
NTDs
4
Taeniasis/Cysticercosis
4
Yaws & other Endemic Treponematoses
4
Earthquake in Türkiye and the Syrian Arab Republic
4
General
4
Mental Health
4
AR (African Region)
4
Tuberculosis
4
Technical Information
4
Poster
4
Clinical Guidelines
4
General Public
4
Stigma
4
Other Resources
4
Context & Facts
4
Maps
4
Laboratory & Diagnostics
4
Case Definitions
4
Communication & Training
4
Global Burden of Disease
4
Treatment & Clinical Management
4
Rapid Response
3
Demographic Transition
3
Integration
3
Epidemiology & Sitreps
3
Humanitarian Settings
3
Dengue
3
Training
3
Sexually Transmitted Infections
3
IEC Materials
3
Prophylaxis
3
African Region
3
Maps
3
Cholera
3
Communication
3
Public Health
3
Humanitarian Aid
3
Common Good
3
Principles of Solidarity
3
Subsidiarity
3
Children
3
Encyclical Letters
3
COVID-19 Simulation Exercise Training
3
Environmental NPIs
3
Caregiver
3
Other Countries
3
Model Formulary
3
Pharmaceutical Dosage Forms
3
Information Refugees Ukraine
3
Information, Resources & Websites
3
Capacity Building & Resources
3
Clinical Aspects & Diagnostics
3
Clinical Aspects & Diagnostics
3
Clinical Aspects & Diagnostics
3
Clinical Aspects & Diagnostics
3
Information & Education Material (IEC)
3
Statistics & Facts
3
Statistics & Facts
3
Statistics & Facts
3
Echinocccosis
3
Diagnosis
3
Modules
3
Prevention of Disabilites
3
Technical Information
3
Reproductive Health
3
HIV / AIDS
3
Assessment Tools
3
Kazakhstan
3
Best Pratice Examples
3
Communication Tools
3
Planetary Health
3
Chikungunya
3
Resource Platforms
3
Clinical Guidelines
2
HIV support organizations
2
Biosafety
2
Clinical Guidelines
2
For General Public
2
Hygiene
2
Vaccination
2
Plague
2
Neuropsychology of Trauma
2
High Risk Groups
2
Eating Disorders
2
Online Resources
2
IEC Materials
2
International
2
Laboratory
2
Priority Assistive Products
2
Public Health
2
Child Health / Pediatrics
2
Information for different audiences
2
IEC Material Mental Disorders
2
GO pre-deployment training
2
Communication & Training
2
Best Practice
2
Risk Communication
2
Poster & Infographics
2
Volunteer Engagement
2
COVID-19
2
Social Ethics
2
Stigmatisation
2
Vaccination & Strategy
2
Vaccine Candidates & Research
2
Dashboards & Resource Platforms
2
Capacity Building
2
Online Resources
2
Pocket Cards
2
Medicine Donations
2
Standard Operating Procedures (SOPs)
2
Health Consequences
2
More Information Refugee and Health
2
Pakistan Flood 2022
2
Capacity Building & Resources
2
Capacity Building & Resources
2
Capacity Building & Resources
2
Disability Prevention & Rehabilitation
2
Information & Education Material (IEC)
2
Statistics & Facts
2
Information & Education Material (IEC)
2
Policies & Strategies
2
Scabies
2
General Information & Methodology
2
Air Pollution
2
Armenia
2
Botswana
2
Bioterrorism
2
Regional Reports & Guidelines, others
2
IEC Material Children
2
Regions
2
Miscellaneous
2
Global Health Education
2
Disability (CBR)
2
Understanding Global Health
2
Resource Platforms
2
Going abroad
2
Europe
2
IEC Material Neurological Disorders
2
Vaccination
2
Clinical Guidelines
1
Guillain-Barré Syndrome
1
Intercultural Competence
1
Cancer
1
Clinical Guidelines
1
Maps
1
Pediatrics
1
Zambia
1
Dictionaries & Interpreting
1
Capacitiy Building
1
Maps
1
Public Health
1
Natural Hazards
1
Diabetes
1
Key Resources
1
e-Learning
1
Key Resources
1
European Resource
1
Belarus
1
Psychosocial Support
1
DR Congo
1
Research & Development
1
Video & Audio
1
Human Dignity
1
Videos
1
COVID-19 Vaccination Information
1
mRna Vaccines general
1
Johnson & Johnson
1
Sputnik V
1
Inactivated COVID-19 Vaccines
1
Key resources
1
Patient care
1
Standard precautions
1
Online Courses
1
Internet Resources
1
Latin America
1
Chile
1
Triage
1
Pharmacy
1
Resource platforms
1
Various Target Groups
1
Resource Platforms
1
Economics
1
COVID-19
1
Psychosocial Support
1
Emergency health kits
1
Emergency health kits
1
COVID-19
1
Schistosomiasis
1
Capacity Building & Resources
1
Information & Education Material (IEC)
1
Information & Education Material (IEC)
1
Statistics & Facts
1
Statistics & Facts
1
Statistics & Facts
1
Other NTDs
1
Dracunculiasis (guinea-worm disease)
1
Prevention & Control
1
Soil-transmitted helminthiasis
1
West and central Africa
1
Studies & Reports
1
Online courses
1
Studies & Reports
1
Studies & Reports
1
Others
1
Risk Factors
1
Alcohol Consumption
1
Tobacco Consumption
1
Language Teaching
1
Community Based Rebabilitation (CBR)
1
Liberia
1
Clinical Guidelines
1
Zika
1
Zika
1
IEC
1
Polio
1
Albania
1
Africa
1
Lesotho
1
Health Policy & the Global Health Landscape
1
Training
1
Typhoon
1
Epidemiology
1
Orientation Guides
1
Radiological & Nuclear Hazards
1
Laboratory
1
Persons with Handicaps
1
Chemical Emergencies
1
Marburg Virus Situation Reports
1
Key Resources
1
Normative Dimensions of Global Health
1
Key Resources
1
AMR
1
Germany
1
Country Specific Information
1


This report is intended to provide information regarding reporting status of the public and private hospitals, availability and utilization of hospital services, performance of the hospitals under administration of Ministry of Health, hospital deliveries and leading causes of hospitalization and mor...
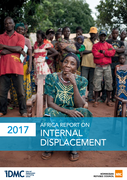
Torrential rains and the onset of Cyclone Komen triggered severe and widespread floods and landslides in July and August 2015 across 12 out of 14 states and regions in Myanmar. An estimated 1.6 million individuals were recorded as having been temporarily displaced from their homes by the disaster, a...

This report complements the previous poverty analysis studies by presenting a series of poverty maps of Rwanda at cell and sector levels, based on data from EICV4 and the 2012 Population and Housing Census. A poverty map is simply a map that shows the incidence of poverty in different areas of the c...

This report provides an update on the level of poverty based on 2013/14 Integrated Household Living Conditions Survey (EICV4) focusing on poverty as measured in consumption terms. The report also highlights other trend dimensions of living conditions captured in other surveys that complement and pro...
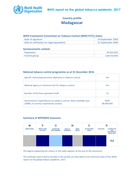
World Health Organisation Report on the global Tobacco Epidemic Rwanda Country profile (2017)

TEP UP Technical Working Paper

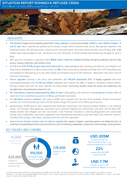
This report, examining the mood of a country that holds the top spot in the Fragile States Index, is based on field research conducted in South Sudan in April and May 2014.

This report highlights key achievements registered by the Ministry of Health, affiliated institutions, implementing agencies both at central and decentralized levels in 2013-2014. Generally, the Health Sector accomplishments and programs routine data for 2013-2014 confirm that Rwanda maintains its p...
covering 05th June - 20th June
This report has been developed, based on data provided by the TB & ORD surveillance system from across Rwanda. It provides a comprehensive picture of the occurrence and management of TB & ORD and Leprosy in Rwanda. It is structured based on the 2013-2018 Rwanda TB national strategic plan (2013-2018 ...
This report provides a comprehensive overview of the progress made by India in terms of establishment and functionality of Special Newborn Care Units (SNCUs) during the two year period from April 2013 to March 2015. It describes the progress in the operational status (numbers, bed strength, human re...